What is a Triple Bottom Pattern?


All reviews, research, news and assessments of any kind on The Tokenist are compiled using a strict editorial review process by our editorial team. Neither our writers nor our editors receive direct compensation of any kind to publish information on tokenist.com. Our company, Tokenist Media LLC, is community supported and may receive a small commission when you purchase products or services through links on our website. Click here for a full list of our partners and an in-depth explanation on how we get paid.
What does it mean when a stock bounces off the same support level three times?
That’s the triple bottom pattern, a bullish signal that often marks the end of a downtrend. Each rebound shows sellers losing momentum and buyers stepping in with greater strength, setting up a potential breakout to the upside.
For traders, it highlights a shift from bearish to bullish momentum. For dividend investors, it can point to attractive entry points near relative lows, where yields are higher and future price gains more likely. Recognizing this pattern adds confidence to both short-term trades and long-term strategies.
- Defining the Triple Bottom Formation
- Psychology Behind the Triple Bottom
- Identifying the Triple Bottom
- Triple Bottom vs Double Bottom
- Relevance for Dividend Investors
- Strengths
- Risks and Drawbacks
- Tools and Indicators
- Conclusion
- FAQs
Defining the Triple Bottom Formation
The triple bottom is a form of bullish reversal pattern that forms after an extended period of downtrend and signals that selling pressure is weakening and buyers are taking control. It has three separate troughs developing at roughly the same support level with each followed by a rebound. This kind of repeated defense means that the market is not willing to drive prices much lower, which means that demand is starting to outstrip supply.

The pattern is confirmed with price breaks above the resistance level, or neckline, drawn across the highs of the rebounds between troughs. This breakout indicates that the downtrend has ended and an upward move in price is likely. Volume helps to prove the setup, as stronger activity on the breakout helps to provide credibility to the reversal.
For traders, the triple bottom is a source of reliability, as it provides both obvious support levels, as well as a defined breakout point. It is the reflection of repeated rejection of the lower prices along with the rising buying momentum. Dividend investors can also benefit from identifying this formation as it will point to potential entry points in dividend-paying stocks at attractive valuations ahead of a rebound. When used in conjunction with other tools, like dividend safety analysis, the triple bottom doesn’t just help provide better timing, it also helps support strategies that balance return potential with risk management.
The Market Psychology Behind the Triple Bottom
The psychology of the triple bottom is that it is the battle between buyers and sellers at a key price level. Each time the stock nears support, there are sellers attempting to drive the stock lower, but there are always buyers stepping in to stop the stock from dropping. This repetition of defense is a signal to the market that the stock is undervalued and creates a psychological floor. With each test, confidence builds, and buyers are more willing to act sooner, reducing downside risk—something often highlighted in leading stock market newsletters as a sign of potential accumulation.
Meanwhile, sellers lose momentum as they fail time and again to break support. Each unsuccessful attempt represents weakening conviction, causing some bearish traders to exit positions, causing still more selling pressure. As this balance is changed the market consolidates and buyers start to accumulate shares in anticipation of a breakout.
By the third trough, sentiment has frequently turned to optimism. Traders search for a move above neckline resistance as evidence that buyers have taken control and selling pressure is exhausted. For dividend investors, this is particularly true, as the pattern often appears in stable companies where long-term value aligns with sustainable income investing that emphasizes both growth and dependable payouts.
Ultimately, the triple bottom is more than just a chart shape, but represents the shift from uncertainty to confidence that creates the environment for a bullish reversal which draws new capital.
Identifying the Triple Bottom on Charts
Spotting a valid triple bottom involves analyzing price structure carefully and confirming signals. The first step is identifying three troughs around the same level of support. These lows need to be relatively symmetrical, which demonstrates that the market consistently values the security at that price. While not perfectly even, they should be within a tight range to confirm strong support, especially in payout producing equities where consistency at key levels matters to long-term investors.
Volume provides an additional layer of validation. Declining volume during each test of support shows weakening selling pressure whereas rising volume on rebounds reflects growing interest by buyers. The most important signal comes at the breakout stage; there should be a surge in buying volume to go with the move above the neckline. Without it, the breakout is in danger of failure.
The neckline or resistance line is drawn across the highs between troughs. A triple bottom is only confirmed if price breaks above this neckline decisively with preferably heavy volume. Many of the traders wait for this breakout to enter their trade because it turns this pattern from a potential to a confirmed reversal.
For dividend investors, understanding the structure provides extra value. Early recognition gives the chance to buy near long-term support, while confirmation above the neckline signals the start of a rally. This not only improves the income potential but also enhances the prospects for capital appreciation, making it a valuable tool within broader income investing strategies.
Triple Bottom vs Double Bottom
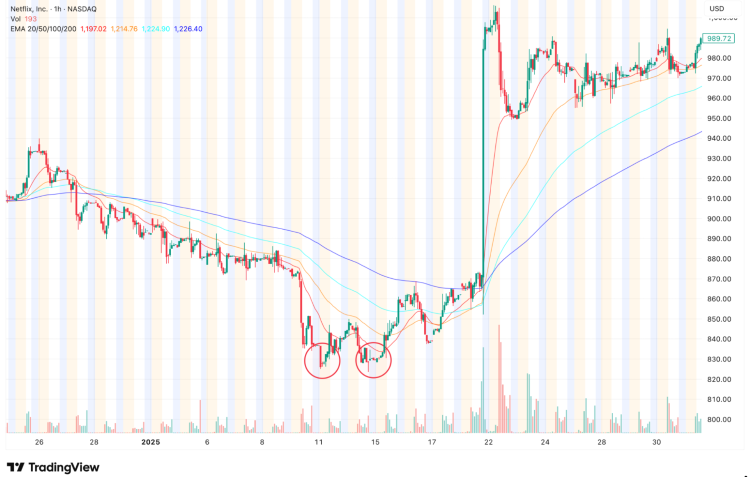
Both the triple bottom and double bottom are bullish reversal patterns but have different structures and strength of confirmation. A double bottom is formed when price tests support twice and rebound, creating a “W” that signals buyers stepping in after selling pressure. The triple bottom adds a third test, which creates three troughs before breaking resistance. This extra try makes it a stronger indication that sellers are exhausted and buyers are taking over.
The most significant difference is in the market evidence. With only two lows, the double bottom can sometimes indicate a pause in a downtrend rather than a complete reversal. By requiring a third test, the triple bottom offers stronger confirmation that the price floor is valid. This repetition reduces the likelihood of false signals and increases confidence in an upward breakout once the neckline is cleared. Netflix (NFLX) provided a clear example in January 2025, when a triple bottom formed just before NFLX shares surged after its earnings report beat expectations.
For dividend investors the difference is equally important. A double bottom may indicate an early entry in dividend paying stocks, but comes with more risk of failure. The triple bottom, having tested downside pressure very thoroughly, provides a better point to base long-term positioning. Both patterns are bullish, but the triple bottom is a more solid foundation for buying in dividend-based strategies.
Relevance of Triple Bottom for Dividend Investors
The triple bottom is especially useful to dividend investors due to the potential entry points into income generating stocks. When a dividend paying stock forms three lows at the same support level, it indicates repeated failures by the market to take the price lower. For investors, this implies little downside risk and a probable reversal. Entering close to these levels helps them to secure higher yields, as the yield will increase as the price decreases, while also setting a position for capital appreciation following a breakout.
While dividend strategies focus on stability, timing is still important. Buying during a triple bottom can help investors avoid overpaying in weak markets while capturing discounted income opportunities. The pattern can also serve as a confirmation that a stock has found solid technical support consistent with fundamentals such as steady cash flow and a sustainable payout ratio.
For reinvestors, the triple bottom provides additional advantages. Dividends reinvested near the lows of the pattern may compound more effectively as prices recover, boosting long-term growth. Some investors even use tools similar to a dividend portfolio calculator to project how such reinvestments could improve income streams over time. Though no chart formation is flawless, combining triple bottom analysis with dividend fundamentals offers a tactical edge. It helps balance income production with growth potential, aligning technical signals with the broader goals of dividend-focused portfolios.
Strengths of Using the Triple Bottom Pattern
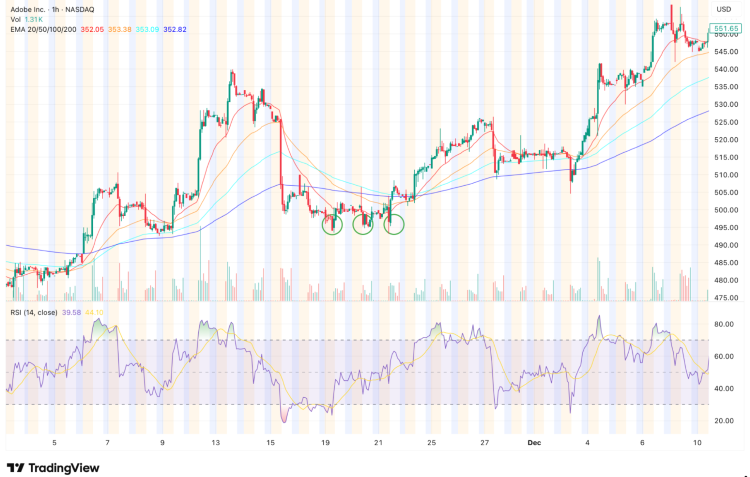
The triple bottom is known to be a reliable formation due to its clear structure and confirmation of support. Unlike patterns that are based off of a single reversal signal, it depicts multiple failed attempts by sellers to force a stock below a key price floor. Each trough near the same level reinforces the strength of support, and gives traders and investors much more confidence that downside risk is limited. This repetition also makes the pattern easier to identify, and generally more dependable, than single- or double-bottom setups. The setup in Adobe’s stock formed in late November 2024, when broader markets slipped ahead of Thanksgiving as Nvidia and Dell dragged tech shares lower.
Another strength is its alignment with volume analysis. During downtrends, volume often declines, while rebounds see increases that signal buyers are slowly regaining control. A breakout above the neckline with a surge in volume provides strong confirmation that momentum has shifted to the upside. This combination of price and volume helps reduce false breakouts, making it useful for both active traders and dividend-focused investors—as seen recently when Kohl’s stock surged as the newest meme play, backed by a rush of trading activity.
Historical performance also lends the triple bottom credibility. It has long been recognized as a reliable bullish reversal when confirmed with supporting indicators, much like recent equipment check reports showing energy services stocks poised to rally. For dividend investors, its clarity and reliability add confidence when stepping into income-generating stocks. By integrating strong technical signals with dividend stability, the triple bottom becomes a practical tool for aligning growth opportunities with consistent income strategies.
Risks and Drawbacks of the Pattern
Although the triple bottom is a widely respected bullish reversal signal, it has some obvious risks. One of the most common is the false breakout where prices go just above the neckline before reversing leaving trapped traders who went in early. Without confirmation from other indicators or good volume of trade, these signals can cause unnecessary losses.
Premature identification is another problem. A formation that looks like a triple bottom can be just a part of short-term consolidation or part of a larger downtrend. If the third trough does not form cleanly or the breakout lacks momentum, the pattern may collapse, leaving traders exposed to whipsaws. Volatile markets pose an extra risk—especially during periods like the anxious Wall Street anticipation of the September effect—when price action can create shapes that resemble valid formations but fail under pressure.
Market conditions also have an effect on reliability. However, in strongly bearish environments, even well-formed patterns can break down as larger economic or sector forces override technical cues. For dividend investors, this is important to remember—pairing the triple bottom with fundamental checks is key. Evaluating payout ratios, earnings stability, and recent examples such as Adobe’s stock gains on earnings and revenue beats helps confirm whether a breakout is consistent with the company’s long-term financial health.
By combining technical observations with fundamentals, traders and investors are able to minimize risk and make more disciplined decisions. This layered approach means that the triple bottom is used as part of a larger strategy, and not as a signal in and of itself.
Tools and Indicators to Confirm the Setup
Confirming a triple bottom requires more than the identification of three troughs on a chart. Traders and dividend investors have complementary tools which help to reinforce analysis and weed out false signals. The Relative Strength Index or RSI is particularly useful and indicates whether a stock is coming out of an oversold condition. When RSI climbs as price approaches the neckline it indicates that the momentum is increasing for a breakout.
The Moving Average Convergence Divergence (MACD) is also an added value. A bullish crossover near the breakout often suggests that there are underlying strength supports for the move. Moving averages, for example, the 50-day or 200-day ones, are another form of confirmation, where price not only clears the neckline, but also clears above these long-term trend lines, indicating broader market support. Volume is still crucial—an increase during the breakout lends the setup much more credibility.
For dividend investors, technical checks should be accompanied by fundamentals. Even if charts are pointing to a reversal, it is important to check the payout ratios and cash flow stability. A good dividend profile means the recovery is not just short-term price action.
By stacking the deck of tools such as RSI, MACD, moving averages, and volume with dividend analysis, traders and investors can gain more confidence in the triple bottom, while better managing risk.
Conclusion
The triple bottom is a reliable bullish reversal pattern which shows strong buying support and weakening selling pressure. Its very visible structure helps traders anticipate breakouts and provides dividend investors with a signal to enter positions that have both growth and income potential.
For the dividend-focused strategies, the pattern is particularly useful. Buying near support confirmed by a triple bottom not only sets up investors for capital gains but locks in greater dividend yield on cost and is a practical timing tool.
Still, there is no such thing as a perfect formation. False breakouts and market volatility can play a role in the breakdown of such a setup, which is why it is important to use a combination of technical signals and fundamentals. When combined with other indicators such as RSI, MACD and reports of payout stability, the triple bottom makes a powerful contribution to the wider investing tool set – helping traders and investors find balance between short-term opportunities and long-term goals.
Triple Bottom Pattern: FAQs
-
What Does a Triple Bottom Pattern Indicate in Trading?
A triple bottom pattern means a bullish reversal. It happens after a downtrend when a stock reaches a support level three times without breaking lower, indicating that sellers are losing control and buyers are stepping in. For long-term investors, this kind of pattern can also highlight shares that pay regular dividends, offering both income and upside potential when momentum shifts.
-
How Is a Triple Bottom Different From a Double Bottom?
Both are bullish reversal patterns, but a triple bottom has three distinct lows rather than two. This provides stronger confirmation of support, since the market has tested and respected the same level multiple times before attempting a breakout. That added confirmation makes the pattern particularly useful for those following a dividend appreciation strategy, where the focus is on income growth alongside capital gains.
-
Why Is the Triple Bottom Relevant for Dividend Investors?
For dividend investors, the triple bottom can highlight attractive entry points at lower prices. Buying near these levels may maximize yield on cost while positioning for price appreciation if the breakout unfolds as expected. Many investors also look to reputable stock advisory services for additional confirmation, combining professional guidance with technical setups to refine timing and reduce risk.
-
What Indicators Confirm a Triple Bottom Breakout?
Common indicators include spikes in volume during the breakout above the neckline, momentum indicators such as RSI moving into bullish territory, and confirmation from trend following indicators such as moving averages or MACD crossovers.
-
Can a Triple Bottom Pattern Fail To Play Out as Expected?
Yes, like any chart pattern, a triple bottom may fail. False breakouts result when the price goes higher for a moment but reverses, or when broader market conditions overwhelm the set up. Traders should always use stop loss orders and should combine technical analysis with fundamental checks to cope with the risks.
All reviews, research, news and assessments of any kind on The Tokenist are compiled using a strict editorial review process by our editorial team. Neither our writers nor our editors receive direct compensation of any kind to publish information on tokenist.com. Our company, Tokenist Media LLC, is community supported and may receive a small commission when you purchase products or services through links on our website. Click here for a full list of our partners and an in-depth explanation on how we get paid.


