Symmetrical Triangle Explained: A Neutral Pattern with Powerful Signals


All reviews, research, news and assessments of any kind on The Tokenist are compiled using a strict editorial review process by our editorial team. Neither our writers nor our editors receive direct compensation of any kind to publish information on tokenist.com. Our company, Tokenist Media LLC, is community supported and may receive a small commission when you purchase products or services through links on our website. Click here for a full list of our partners and an in-depth explanation on how we get paid.
Which way will the market break when prices tighten into a symmetrical triangle?
This common chart pattern shows up when highs get lower, lows get higher, and price action squeezes into a narrow range. It signals a pause where buyers and sellers are evenly matched, but a breakout is coming.
For traders, the symmetrical triangle highlights a buildup of pressure that often resolves with sharp movement. For dividend investors, spotting it matters too. A breakout can shape entry timing, helping avoid weak spots or catch momentum before it runs.
By recognizing this setup, you can make more confident decisions when volatility returns.
- Definition
- Investor Psychology
- Identifying the Formation
- Symmetrical vs Ascending and Descending Triangles
- Relevance for Dividend Investors
- Benefits
- Risks and Misinterpretations
- Technical Tools
- Conclusion
- FAQs
Defining the Symmetrical Triangle
The symmetrical triangle is seen in a consolidating market where buyers and sellers don’t always have an advantage. Two trend lines make up the pattern, the upper trend line slopes downward and will connect the lower highs, while the lower trend line slopes upward and will connect the higher lows. As prices are squeezed between them the triangle shrinks and to the right. This shape draws demand back at lower levels and supply at higher levels.

The primary characteristic of the symmetrical triangle is neutrality. Unlike an ascending triangle, which tends to be bullish, or a descending triangle, which can often show weakness, the symmetrical triangle will lack any bias until it breaks out. It shows indecision in the market: traders are sitting tight and waiting for something that could lead to a change of momentum. The more time the pattern remains in place, the more significant the move possibly, since the longer the consolidation occurs, the more pressure is built.
symmetrical triangles can exist for a number of weeks or months. Their worth is derived from the sharp move that usually follows. Traders look for a breach of the trend lines, without ambiguity, and confirm it with higher volume. Investors should recall that the market can move from a calm state to a volatile one in a short period of time, so it is risky to get in before the channel is confirmed.
Investor Psychology Driving the Pattern
The psychology of the symmetrical triangle is that of a market in equilibrium with neither buyers nor sellers in control. Each rally stops at lower highs which means sellers are still in play. The pullbacks occur at higher lows, indicating that buyers are entering with confidence. The price range is then gradually narrowed by this tug-of-war.
The contraction is indicative of hesitation. Traders are waiting for something that will initiate the next trend: economic data, earnings, or general market movements. During this phase volume will typically come into the decline showing fewer willing to commit until the direction is clear. This downward movement is no weakness; it is an indication that pressure has been building just beneath the surface as both parties ready themselves for a resolution.
Eventually, one side or the other wins. A breakout above resistance is bullish and can create powerful upward momentum. This is usually followed by a steep drop as the support is lost. The psychology of the symmetrical triangle is then, of building tension that can only continue for so long. This is important for investors to be aware of because it explains the reason why the breakout is often so powerful: it is simply the release of the energy accumulated during the consolidation.
Identifying the Formation on Charts
Spotting a symmetrical triangle Begins with its Two Converging Trend lines. The upper line is connecting the lower highs, while the lower line is connecting the higher lows. Together they form a triangle that gets narrower as the fluctuations in price decrease. This contraction is a signal to the market of consolidation and pressure building.
Volume trends are important in the confirmation of the set-up. As the pattern is forming, volume tends to fall as both buyers and sellers wait for direction. This reduction often precedes a decisive breakout. The best confirmation comes when price breaks above or below the triangle with a clear spike in volume, showing that one side has taken control. Recent debates over whether China’s surging stock market is a boom or a bubble illustrate how shifts in volume can fuel powerful moves once sentiment tips.
Patience is extremely important when analyzing charts. Traders should let the pattern fully form, draw trendlines forward to predict breakout points of the pattern, and wait for multiple touches on both support and resistance to validate the pattern setup. A good example of this is assuming the direction of the breakout too early, as the formation is neutral until proven otherwise. By paying special attention to the converging highs and lows, watching volume and waiting for a decisive move outside of the boundaries, investors can identify symmetrical triangles with greater confidence and prepare for the volatility that often accompanies them.
Symmetrical vs Ascending and Descending Triangles
The symmetrical triangle is often compared to the ascending triangle and descending triangle. All three have a contracting shape but suggest different end results. The symmetrical triangle forms when lower highs intersect higher lows, signaling market indecision. It has no obvious bias until a breakout, and traders must wait for confirmation before acting. A similar uncertainty was visible when gold hit fresh all-time highs as the U.S. government shutdown dented risk appetite, underscoring how external events can tip a neutral setup in either direction.
The ascending triangle is generally bullish. It is a formation that occurs when price tests a flat resistance line and forms a higher lows underneath. This pattern indicates a strengthening of buyers. When price breaks above the resistance there is often a strong rally, even more so if volume increases.
The descending triangle, in general, is bearish. It forms as price continues to support the same price and forms lower peaks above it. This indicates increasing selling pressure and fall in demand. Breakdowns under support typically result in further declines.

For investors, the distinction is quite simple. Ascending and descending triangles tend to favor one direction while the symmetrical triangle presents a balance. Dividend traders in general should be patient with symmetrical patterns. Waiting for a confirmation reduces the risk of early entries and keeps an eye on income goals – and market conditions.
Relevance for Dividend Investors
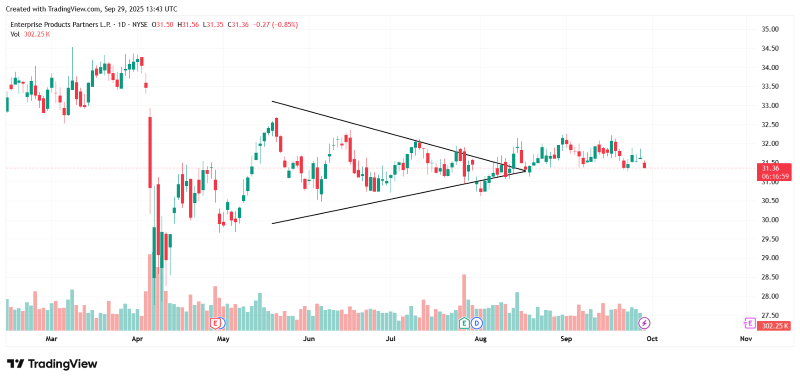
When dividend investors see a symmetrically-shaped triangle, they know that the stock is consolidating before the next great move. Even though dividend-stock securities are selected for stability, stock prices react to market sentiment, earnings news, and general economic changes. Enterprise Products Partners L.P. (EPD), for example, has spent much of this year forming a near-perfect symmetrical triangle as energy prices and income-focused demand kept the stock in balance, following the sharp drop markets experienced after tariff news in early April. A triangular pattern indicates that buyers and sellers are fine but pressure is accumulating below.
The primary advantage of income-oriented portfolios is that firm commitments are not made in advance. Buying while the triangle is in the formation can tie up capital in a stock that has no direction. Even if dividend payments remain the same, down in the breakout signifies not only capital losses and a loss of confidence but also an underlying structural change. By being patient and waiting for a clear confirmation, it is possible to enter at the end of momentum, minimizing the risk of being on the wrong side.
At the same time, an upside breakout will provide a timely opportunity. Buying at the immediate bottom of a pattern bottoms out after it unloads for buyers, which means you can get your hands on shares at attractive levels before momentum takes over and you are locked in to dividend yields that can drop as prices start to climb. By increasingly keeping an eye on symmetrically-shaped triangles, dividend investors bring discipline to their approach and ensure that their pursuit of stable income is reinforced by more precise timing, heightened risk management and more flexible adaptation to market dynamics.
Benefits of Monitoring the Symmetrical Triangle
One of the primary things about watching the symmetrical triangle that is such a great advantage is how visible the shape is. The converging lines of lower highs and higher lows make it easy to pick out on a chart, even for someone who is a beginner at technical analysis. This is a simple design which allows investors to quickly see when the market is consolidating and ready for a decisive move. Because the pattern is visually distinctive, it is a useful tool for active traders as well as for long term investors attempting to anticipate volatility.
Another plus is the frequency of occurrence of the symmetrical triangle. It is one of the most common consolidation patterns, as it appears on multiple timeframes and across different asset classes. Just a few months ago, analysts were noting that investors should look for consolidation before stocks retest all-time highs, underscoring how often this setup becomes relevant. This makes it a reliable component of technical analysis, allowing investors to apply it consistently in their assessments. Its widespread presence also gives it value for short-term trade setups as well as broader portfolio planning.
Perhaps the biggest benefit of the pattern is its use to predict breakouts. As the price range gets narrower, pressure mounts and when it finally breaks the move is often sharp. For dividend investors, this foresight is of particular use. Watching the pattern avoids premature entries into weakening positions and allows one to act faster in the event of a bullish breakout with an attractive entry opportunity. This combination of clarity, frequency and predictive power makes the symmetrical triangle an all-rounder, for balancing the need for steady dividend income with chances for capital appreciation.
Risks and Misinterpretations
As with any chart pattern, however, symmetrical triangles carry risks investors need to watch for. The most common trap is a fakeout breakout, where price briefly escapes the triangle only to reverse back inside. Traders who rush into these signals can end up in losing positions, and this risk applies just as much to dividend timing trades. To minimize the chance of being caught, the move should be sustained and ideally supported by volume.
Another obstacle is misidentification. Of course, prices are inherently random, so it is easy to find converging lines far too early and mistake normal noise for a real formation. A lot of time, decisions are made off faulty and loosely drawn triangle lines. Another fallacy is to make assumptions about the direction of the breakout before it happens. Unlike the rising tops or falling tops, the symmetrical top is a neutral structure. A move that is predicted but not confirmed can act to place capital on the wrong side of the eventual trend.
With this in mind, these risks underscore the importance for investing in dividends combining technical insights with fundamental analysis. Even if the stock breaks out mildly, its long-term suitability will depend on payout ratios, the stability of earnings and the strength of cash flows. A positive dividend history doesn’t guarantee a safe dividend. By combining technical analysis with diligent fundamental research, investors can gain a more complete picture and avoid pitfalls while positioning for both stable income and capital appreciation.
Confirming the Breakout with Technical Tools
Breaking out of a symmetrical triangle requires more than just price action. Technical tools instill additional confidence and stop you from making wrong moves. An RSI is particularly valuable because if the breakout or downside move is accompanied by an increasing or decreasing momentum, it supports the validity of the direction. The Moving Average Convergence Divergence (MACD) can also verify signals on crossovers. A bullish pattern usually indicates a change in trend when it is made during a bullish breakout, or when a bearish one occurs during a downward breakdown. Guidance from trusted financial advisory letters can further strengthen conviction when their outlook aligns with these signals.
Moving averages are also of significance. When the price is above the short or medium term moving average, such as the 50-day, that is considered stronger momentum. Conversely, a key moving average falling below can indicate long-term weakness. Support from reliable market advisory services can help investors validate these signals within a broader market context.
Volume is another key factor. Without a distinct uptick in volume, even a buy signal breakout with all these indicators can be more of a weak signal and potentially a double-topper.
Fundamental analysis must be combined with technical analysis for dividend investors. A bullish breakout is most compelling when the company exhibits strong dividend trends – a reasonable pay-out ratio, stable earnings and consistent cash flow. This convergence makes the technological arrangement supported by financial robustness.
By combining RSI, MACD, moving averages, and dividend analysis on top of one another, investors can approach symmetrical triangle breakouts with more confidence. This strategy provides a balance between capital growth opportunities and the stability of long-term income.
Conclusion
The symmetrical triangle is a flexible formation that represents consolidation and often leads to a decisive breakout. Its peaks and valleys show equilibrium in the market, while the eventual movement signals the beginning of a new trend. For traders and investors, it allows them to get an early signal that volatility is building and direction will soon be becoming apparent.
For dividend investors, it is the timing that is important. This trend can help to prevent a premature entry into income stocks that may break down, as well as some opportunities for buying in advance of an upward move. This balance between capital protection and growth capture is suitable for long-term dividend strategies.
However, the pattern alone should not be used. Couple it with technical confirmation and basic dividend analysis for further support of decisions. Combining these perspectives can better enable investors to handle uncertainty, hedge risk to income portfolios and position for both stability and growth.
Symmetrical Triangle Pattern: FAQs
-
What Does a Symmetrical Triangle Pattern Indicate?
A symmetrical triangle indicates consolidation; a state of affairs where buyers and sellers appear evenly matched. The price consolidates into a narrowing range which builds pressure that often results in a sharp breakout. Since there is a possibility for this move to go either way, we need clear confirmation.
-
How Is a Symmetrical Triangle Different From Ascending or Descending Triangles?
The symmetrical triangle itself is neutral, formed by converging highs and lows without a bullish or bearish bias. An ascending triangle is usually bullish with a rising support and a flat resistance. A falling triangle is a bearish triangle with falling resistance and flat support. The symmetrical pattern, on the other hand, requires confirmation before trading.
-
Why Should Dividend Investors Watch for Symmetrical Triangles?
Dividend investors can use this pattern to their advantage if they want to more precisely plan their entry time. By waiting for a breakout they don’t buy too early into weakness or miss the move just before momentum builds. Identifying consolidation is also useful for aligning dividend strategies with more favorable market conditions, much like how analysts recently pointed to a breakout forming in a mining stock as copper prices found their footing.
-
What Indicators Confirm a Breakout From a Symmetrical Triangle?
RSI, MACD and moving averages are popular technical analysis tools for confirmation. A bullish RSI, MACD crossing in breakout direction, or price crossing key averages all serve to strengthen the signal. Surge in volume is also an important confirmation.
-
Can a Symmetrical Triangle Pattern Fail To Produce a Breakout?
False breakouts do occur, when price briefly moves outside the triangle then soon reverses, or when consolidation stretches out over an extended period of time. Combining technical confirmation with other dividend aspects like payout ratio and cash flow helps in reducing this risk.
All reviews, research, news and assessments of any kind on The Tokenist are compiled using a strict editorial review process by our editorial team. Neither our writers nor our editors receive direct compensation of any kind to publish information on tokenist.com. Our company, Tokenist Media LLC, is community supported and may receive a small commission when you purchase products or services through links on our website. Click here for a full list of our partners and an in-depth explanation on how we get paid.


