The Megaphone Pattern: What It Reveals About Market Uncertainty


All reviews, research, news and assessments of any kind on The Tokenist are compiled using a strict editorial review process by our editorial team. Neither our writers nor our editors receive direct compensation of any kind to publish information on tokenist.com. Our company, Tokenist Media LLC, is community supported and may receive a small commission when you purchase products or services through links on our website. Click here for a full list of our partners and an in-depth explanation on how we get paid.
What does it mean when a stock chart starts to stretch wider instead of narrowing down?
That’s the broadening formation, also called the megaphone pattern, and it points to rising volatility. Prices swing between higher highs and lower lows, showing that both buyers and sellers are pushing harder but with no clear winner yet.
For traders, this setup warns of unstable conditions but also hints at major breakouts ahead. For dividend investors, it’s a red flag that a stock once valued for stability may be entering a riskier phase. By spotting this pattern early, you can manage risk, time your entries and exits, and protect dividend portfolios from sudden swings.
- Megaphone Pattern Defined
- Psychology Behind the Pattern
- Identifying the Pattern
- Broadening Formation vs Other Patterns
- Why Dividend Investors Should Pay Attention
- Advantages
- Limitations and Risks
- Tools and Indicators
- Conclusion
- FAQs
Defining the Megaphone Pattern
The broadening (megaphone) pattern is a chart pattern that indicates the emergence of volatility and indecision. It forms between two divergence lines as price is making new highs and lower lows. The new swing is bigger than the previous swing, so it looks like a megaphone opening up on each swing, and is easy to pick up.

Unlike triangles or wedges shaped patterns that are shrinking, the broadening formation is broadening over time. Every peak exceeds the prior peak and every trough depresses below the prior trough. This divergence indicates a market that is unable to decide, which leads to bigger moves in either direction.
For traders, the megaphone pattern indicates that the battle between the buyers and sellers is heating up, but neither side can win the conflict. This competition results in unpredictable price actions that often lead to a sharp breakout when momentum is clearly in one direction or the other. For long-term investors, especially for those who base their investment on dividend paying stocks, this trend is important. Volatility can help open up opportunities to buy undervalued stock during significant corrections, but it also magnifies the risk of market or company instability.
By recognizing the structure and meaning of the pattern, investors may better prepare themselves for the uncertain conditions and harness that insight in their decision-making when it comes to both entering and managing risk.
Investor Psychology Behind the Pattern
The Expansive Configuration represents an uncertain market. The trend emerges when there are no buyers or sellers in control and more and more aggressive trading between the two sides occurs. Buyers force prices to new highs only to create powerful selling that pulls prices to new lows. Each phase of purchase and sale gets bigger, thus forming the ever-expanding triangle that is this pattern.
This process appears as a kind of tug-of-war as a result of indecision. When they don’t have a value to hang on to, investors swing to extremes. Optimism creates rallies, as seen recently when the Dow and S&P 500 hit record highs even while Wall Street shrugged off government shutdown concerns, but a lack of faith quickly turns them around. Each move destabilizes the market, as neither side puts up a fight. As confidence disappears, volatility increases.
Eventually, the increasing formation breaks down. When one side finally overwhelms the other, the pattern is terminated with a powerful breakout. The underlying forces of fear, greed, and doubt move in unison, providing propulsion for a strong move. Dividend investors must be aware of this psychological background. Volatility can spike prices without showing the stock or sector is fundamentally strong or it can show deeper weakness. By understanding the evolution of sentiment in the broadening formation, investors can avoid being surprised by random gyrations and may be able to position for opportunities once the war is over.
Identifying the Pattern on Charts
A broadening formation is characterized by diverging trendlines that create a megaphone pattern. The upper line is joined by higher highs across the time and the lower line drops to lower lows. Unlike the tightening of triangles or wedges, these lines are moving out indicating that the price swing is increasing. The widening shape is the distinctive feature of the pattern.
Volatility is another major indicator. At first, the price movement may be small, but as the pattern evolves the price changes become even bigger and more dramatic. Every mountain rises higher and higher, and every valley is lower and lower. The increasing volatility indicates a lack of consensus among buyers and sellers, leading to price extremes.
Volume adds confirmation. In many broadening formations volume increases with the widening of the range of prices. Sudden spikes during rallies and during falls demonstrate an increasing struggle between market participants and enhances the trustworthiness of the pattern. The most powerful breakout, either up or down, is one that is accompanied by high volume, as that shows that one side has gained control.
By monitoring for divergences in trendlines, increasing volatility, and corresponding volatility in volume, traders can confidently identify the broadening formation. Being prepared for these signals trains them for the big moves that typically follow once the battle has been worked out.
Broadening Formation vs Other Patterns
The broadening formation is unique from other common chart setups due to the expanding nature of the formation. Rather than contracting like triangles and wedges it expands, with trendlines diverging from each other to create higher highs and lower lows. This indicates a less stable market reversing itself and moving outwards instead of converging on a single decision point, thereby showing ever-increasing uncertainty and volatility.
In a symmetrical triangle, the level of tension between buyers and sellers gradually increases until a breakout takes place. The same can be said for wedges, as contracting ranges indicate the possibility of reversal or continuation. These patterns are like controlled cockpits where pressure has to build up first before it’s released. Delta even showed this recently, with the move followed by United and Delta leading the S&P 500 after the inflation report. By contrast the megaphone pattern is a picture out of control, with both sides hitting extremes, but without focus.

This structural distinction has significant implications for investors. Wedges and triangles tend to give predictable results when volume confirms a breakout, whereas the broadening formation is less reliable in indicating direction and instead predicts an increase in volatility. For dividend investors this is important: a triangle can be a sign of healthy consolidation before further gains are made, while a broadening formation can in many cases be a sign of instability and a threat to any dividend – or in some cases a discounted buying opportunity.
Why Dividend Investors Should Pay Attention
For dividend investors, the broadening formation is not just a technical formation – it has direct portfolio implications. Dividend stocks are appreciated for stability, and this setup is indicative of volatility to increase. Expanding swinging can be a way to buy when there is a sharp sell off and the price declines but only if the company’s fundamentals are sound and its payout remains secure. Entering at these lower levels allows investors to lock in higher yields and be positioned to reap capital gains as and when conditions stabilise.
However, the broadening formation can also provide warning. Larger erratic moves may show lack of confidence in the market or company. Recent examples, such as Conagra Brands stock ticking up on earnings despite facing a rough 2025, highlight how volatility can mask deeper challenges. If earnings decline or payout ratios become unviable, then volatility could be an indicator of underlying issues. In such instances, dividend reliability becomes a concern for investors who should focus on capital preservation.
Recognizing this formation gives dividend investors a tool to navigate turbulence with discipline. Instead of being startled by sudden swing movements, they can anticipate instability, refine entry points, and combine technical cues with fundamental analysis. Using a dividend portfolio tracking calculator alongside these methods helps maintain perspective and balance. This measured approach keeps portfolios resilient—taking advantage when prices surge after declines and minimizing risk when uncertainty runs high.
Advantages of Recognizing the Megaphone Setup
The pattern of the megaphone is easy to spot. Its diverging trendlines resemble the mouth of a megaphone, making it easier to identify than many other patterns. The setup shows a series of higher highs and lower lows, which even new traders can recognize quickly. This clear visual cue helps investors using a dividend income approach gauge when volatility is rising and how it might impact stock yields.
The pattern also serves as an excellent market indicator. The widening swings represent growing uncertainty and indecision that often come before major price moves. Identifying these shifts early allows investors to plan rather than react, which is crucial for those maintaining a consistent dividend strategy. This foresight helps balance the pursuit of steady income with the awareness that prices can fluctuate significantly.
The pattern helps in timing the entry and exit. Steep dips within the pattern may indicate a buying opportunity for fundamentally sound companies at discounted prices. But the pattern is also unstable, which means that patience is also required so as not to enter the trade prematurely before confirming the direction. By combining the megaphone pattern with income strategies, investors can secure attractive yields while being prepared for the big market moves that tend to follow.
Limitations and Risks of the Pattern
The broadening form is visually appealing, but it carries with it serious limitations and risks. The most difficult task is predicting the direction of the breakout. Unlike bullish or bearish patterns, the megaphone is ambiguous. Its alternating swings can be unpredictable, and even seasoned analysts and popular investing publications often caution against relying solely on its signals without broader confirmation.
False signals are also a risk. The trend’s extreme volatility can turn normal market fluctuations into misleading movements. Prices may briefly break a trendline only to reverse shortly after, slipping back inside the formation. Acting on these false signals can result in poorly timed trades, unnecessary losses, or missed opportunities—an issue frequently discussed across leading equity research platforms that emphasize disciplined validation.
Timing is another challenge. The broadening formation is not at an end, it can take much longer than anticipated for it to extend. For dividend investors, entering too early impacts the investor with volatility with no direction confirmation. Therefore, it is important to use both technical analysis and fundamentals together. By considering the payout ratios, earnings stability, and cash flow strength, along with the chart, investors can determine whether to hold a dividend stock through turbulent times or to avoid it.
By understanding these limitations and combining the setup with general analysis, the investor can avoid overreliance on the setup and make decisions that protect long-term income stability and capital.
Tools and Indicators to Confirm the Setup
A broadening formation is only the beginning, and we need technical indicators to determine if it is a market turn or just noise. One of the most useful of these tools is volume. As the pattern forms, the swings tend to widen as volumes tend to rise thereby indicating increasing participation by buyers and sellers. A breakout-up or down is much more reliable if it is supported by a clear volume spike, which indicates the control has been taken by one side.
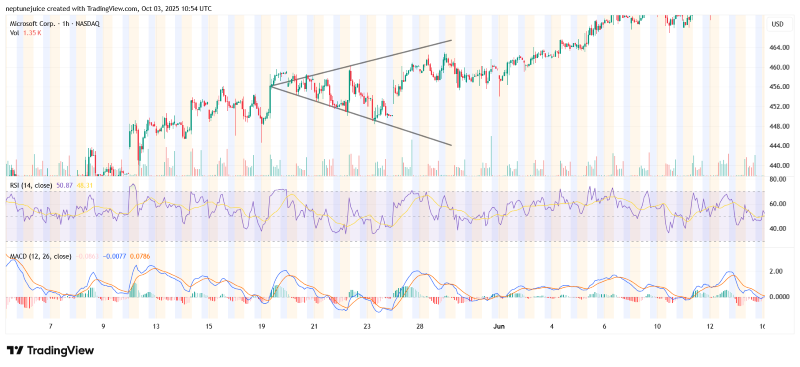
Momentum indicators also prove to be useful. The RSI (Relative Strength Index) shows you if a stock is strengthening as it breaks out to the upside or losing strength as it breaks down to the downside. The Moving Average Convergence Divergence (MACD) can be used to confirm the direction, with bullish or bearish crosses indicating whether the trend is likely to continue. Moving averages also add confirmation; if the price is consistently trading above or below the 50-day or 200-day lines, it suggests the breakout is significant. Microsoft (MSFT) recently offered a clear case, with its stock hitting fresh records and rallying despite weakness in the broader market.
Confirmations for dividend investors might need to go beyond technicals. Even if the breakout is fairly convincing, there are fundamentals that must come into play, such as payout ratios, earnings stability, and cash flow. This combined technical and financial health approach can help investors filter out noise to capture the signal of genuine opportunities, while keeping dividend strategies well anchored in income stability and growth over time.
Conclusion
The broadening formation (megaphone pattern) indicates volatility and uncertainty. Its diverging trendlines and widening swings identify the struggle between buyers and sellers and are typically followed by large movements, signalling that markets are becoming less predictable.
Dividend investors are both rewarded and penalized for this pattern. A sharp drop can be an opportunity to buy strong stocks at a discount, but with that instability, there could be deeper issues.
Also, the megaphone pattern must not be the only reason for a trade. Combine it with other tools – volume, RSI, MACD – and check the payout ratios and stability of earnings for stronger decisions. With strong underpinnings, this pattern serves as a good guide for entering and managing volatility for dividend-oriented portfolios.
Broadening Formation: FAQs
-
What Does a Broadening Formation Indicate in Stock Trading?
A broadening formation indicates rising volatility and indecision in the market. The topping out patterns typically form when price action shifts to generate a higher high and lower low between the diverging trendlines as a result of an indecision between bulls and bears that is likely to end in a breakout.
-
Why Is It Also Called a Megaphone Pattern?
The pattern is typically referred to as a megaphone because it looks like one. As time goes by, the divergence grows, and it appears that the mouth of a megaphone is opening, while price volatility increases—much like recent discussions on Wall Street about a volatility pickup as risks build.
-
How Can Dividend Investors Use the Broadening Formation?
Dividend investors can use the pattern both as an opportunity and a warning sign. The volatility is a red flag to wait and see whether the payout can be maintained and to exercise caution on the amount of capital committed in the way of new investment in fundamentally strong dividend stocks, which can be bought at lower prices if the decline persists within the formation.
-
What Indicators Confirm a Broadening Formation Breakout?
Volume increases are one of the most powerful confirmations, as they indicate conviction behind the move. Additional technical indicators like RSI and MACD can be used to determine the sustainability of the breakout, as well as price action relative to key moving averages.
-
Is the Broadening Formation Pattern Reliable for Long-Term Investing?
The Broadening, less a long-term guide for direction, and more a focus on instability. While it was a sign for big movements, the direction is often not clear until it is confirmed. For long-term dividend investors, the pattern would be helpful only when used in conjunction with fundamental analysis to ensure dividend safety and stability during volatile times.
All reviews, research, news and assessments of any kind on The Tokenist are compiled using a strict editorial review process by our editorial team. Neither our writers nor our editors receive direct compensation of any kind to publish information on tokenist.com. Our company, Tokenist Media LLC, is community supported and may receive a small commission when you purchase products or services through links on our website. Click here for a full list of our partners and an in-depth explanation on how we get paid.


