How Indicated Yield Works and Why It Matters


All reviews, research, news and assessments of any kind on The Tokenist are compiled using a strict editorial review process by our editorial team. Neither our writers nor our editors receive direct compensation of any kind to publish information on tokenist.com. Our company, Tokenist Media LLC, is community supported and may receive a small commission when you purchase products or services through links on our website. Click here for a full list of our partners and an in-depth explanation on how we get paid.
What does indicated yield really tell you about a stock’s dividends right now?
This metric goes beyond past payouts by using the most recent dividend declaration and projecting it forward against the current share price. That makes it a quick way to see what income a company is expected to deliver next. For traders, the number is more than just a return estimate—it can also hint at confidence or concern in the market.
A higher indicated yield often signals strong dividend expectations, while a drop may point to risks ahead, giving traders an edge around dividend news and price moves.
- Defining Indicated Yield
- Indicated Yield vs. Dividend Metrics
- Role in Market Sentiment
- Use in Trading Strategies
- Advantages
- Drawbacks and Limitations
- Comparing Indicated Yield Across Sectors
- Real-World Applications
- Conclusion
- FAQs
Defining Indicated Yield in Simple Terms
Indicated yield will be used to determine the dividend that an investor can get based on the recent dividend of a company. It uses the most recent dividend, and annualizes this amount and then divides it by the current price of the stock. Take the example of a company paying a quarterly dividend of 50 cents per share, the annual dividend will be 2 bucks. At the price of the stock at 40, the yield indicated would be 5% per annum. This calculation provides traders with a visible, future-oriented picture of dividend revenue against current share price.

Indicated yield contrasts with the conventional or trailing yield which is generally quoted in market overviews since it highlights what the firm will pay in the future, not what it has paid. A trailing yield is retrospective of the previous year’s dividend whereas an indicated yield is updated with every new dividend announcement. This creates a sharper view of the current situation and the direction given by management. To traders, such timeliness may be critical in gauging sentiment or anticipating price movement, much like when the S&P 500 ended higher on Nvidia’s gains as traders brushed off Trump’s latest comments on the Fed.
Since it relates dividend expectations to existing stock prices, indicated yield can change rapidly with movements in the market to reflect earnings, policy and/or overall economic factors. The traders who use it get a perspective not only on the prospects of earning income but also on how the market prices this income at any given moment in time. Indicated yield is particularly applicable to active trading because of its combination of simplicity and immediacy.
How Indicated Yield Differs from Other Dividend Metrics
Indicated yield is commonly paired with other dividend statistics but there are some differences that make it particularly valuable to traders. Indicated yield, in contrast to trailing yield, which is backward-looking in terms of the dividends paid during the previous 12 months, projects the latest dividend into the future. Its forward orientation means that it can change rapidly in response to the changes in a company raising, cutting, or beginning a dividend, giving traders a more up-to-date picture of the probable earnings.
It is also different to forward yield although the two are closely related. Forward yield is usually based on analysts’ estimate or company projections of the following year, whereas indicated yield is pegged on the most recent dividend announcement that has been confirmed. That makes it less speculative and more based on the real company action. Traders who desire to reduce uncertainty tend to use indicated yield as it is what management has already decided to distribute.
The other difference is with the dividend rate that indicates an amount of dollars per share of the annual dividends. Dividend rate would offer context; however, it is not taking into consideration the price of the stock. Indicated yield bridges that divide by converting payouts to a percentage of investment cost. As a trader, it is important to understand the differences between the two metrics because each one points out the strength of dividends in a unique perspective. Combining indicated yield with others leads to a more actionable picture that can be used in short-term decisions.
The Role of Indicated Yield in Market Sentiment
Indicated yield will affect the perception of traders and investors about a stock since it indicates the future income. An increase in dividend by a company will increase the indicated yield, which is an indication that the management is confident in its financial position. This has the tendency of attracting income-oriented investors, who further exert some purchase pressure leading to increased prices.
On the other hand, a dividend reduction decreases the indicated yield and generates suspicion of sustainability and the creation of negative momentum. In the sectors where dividends play a central role in valuation, such changes are usually key drivers of price action.
In spotting short-term opportunities, day traders are particularly interested in changes in indicated yield. Dividend announcements or changes in guidance are another potential source of volatility, since small changes to payouts prompt the market to quickly revalue the attractiveness of a stock. An increase in yield can attract purchasers, who are after a stable income, whereas a decrease can trigger selling pressure, which can provide a boost in either direction.
The indicated yield connects dividend policy with the current share prices, it not only describes company activity but also the confidence of the investors. The trackers help traders understand both the potential of income and the wider sentiment. With its fast responses to shifts in indicated yield, day traders can position before the market reacts to such updates and make dividend news a signal that can be acted on.
Using Indicated Yield in Trading Strategies
Yield indicated can be a handy tool in short-term tactics since it establishes a connection between dividend expectancy to market activity. A very clear application is on ex-dividend dates, where prices tend to move in predictable ways. Monitoring the indicated yield, traders can identify those stocks that could draw income-seeking investors and set up trades to exploit volatility before or after the dividend. This short term dividend strategy enables day traders to take advantage of trends that are more a factor of dividend mechanics than fundamental analyses.

It also has a part to play in filtering and watchlist building. Investors can browse through stocks with high yields that are out of line with those of the peers. A higher yield may be used as an indicator of an attractive income flow that will attract investors and increase the number of trades. Simultaneously, it is also able to signal the doubt of the capability of a company to sustain payments. With the use of indicated yield in the screening process, traders are able to quickly identify stocks where there is potential dividend news or a sentiment change to initiate a move.
In volatile markets, indicated yield has more to do with where the herd might gather and less to do with long-term returns. To active traders, it becomes a vehicle to predict short-term price movements, position ahead of announcements and momentum trades as sentiment shifts in and out of dividends.
Advantages of Tracking Indicated Yield
The biggest benefit of tracking indicated yield is that it provides traders with a fast glimpse of the current income potential of a stock. Because the calculation depends on the annualized dividends against the most-recent share price, it provides a current picture of returns likely to be received assuming current dividends are maintained. This is good news to dividend-oriented traders as they can easily compare the opportunities available in various stocks without having to scavenge through all those financial reports.
The other advantage is that it is able to indicate the stability of dividends. The consistency of the indicated yield over the years is an indicator of a steady dividend policy which is appealing to the long-term investors and short-term traders. Consistency also removes doubt, as traders can have greater confidence in what may happen to a stock near a dividend announcement or ex-dividend date, as seen recently when a biotech dividend arrived early and caught traders’ attention.
Indicated yield may also be an indicator of market confidence. When yields increase steeply due to declining prices, this is likely to indicate that investors are concerned about future dividend payout. On the contrary, increasing or stable yields have a positive sentiment. To traders, this relationship between indicated yield and perception goes beyond being a measure of income, but becomes a means to gauge changes in confidence that can trigger short-term price fluctuations.
Drawbacks and Limitations for Traders
Although indicated yield is a good tool in measuring potential returns, it has significant limitations. One of the main limitations is that it supposes the continuation of the dividends at the same rate which is never assured. Companies can reduce or stall payouts on grounds of financial pressure, economic crisis, or broader challenges such as a stagnant job market being cited as a rising risk for the U.S. economy. In this situation, the given yield soon becomes misleading, since projected income is no longer corresponding to reality.

There is also the problem of stock price volatility in interpretation. The ratio can be thrown out of whack by sudden changes in price, which is why indicated yield is divided by the current share price instead of annual dividends. A steep fall in price can cause a yield to seem more attractive than it really is, as a sign of confidence or good fundamentals in a stock may be reversed. On the other hand, it is possible to see the yield becoming less attractive despite the dividend policy, as a vigorous price rally can make it appear smaller—an issue that also comes up in valuation methods like the present value dividend model.
These restrictions make clear why indicated yield should never be applied in isolation by day traders. Although it gives some background on the potential income and the mood, the short-term trading decisions will have to be based on a wider analysis. Technical indicators, price action, and news flow help to incorporate the real-time dynamics with income metrics. When indicated yield is combined with other instruments, traders are not misled and make decisions that take into consideration more opportunities and risks that occur in fast-acting markets.
Comparing Indicated Yield Across Sectors
One size does not fit all in indicated yield and its utility varies across sectors. Utilities, telecommunication, consumer staples are characterized by consistent dividends that are relatively high. In such regions, indicated yield can be used as a good indicator of income and stability of the companies as investors anticipate steady payouts of mature and low-growth business. A utility stock with a steady-looking indicated yield can provide traders with the confidence that the dividend policy is sustainable, and thus it can interest income-oriented strategies.
In comparison, growth industries like technology or other strong equities tend to use their earnings to research and develop novel innovations and to expand instead of making dividend payments. The indicated yields of these companies are quite low or even nil. In this regard, a small or no yield does not mean weakness but underlines a strategic decision-making process to focus more on growth than income. This reduces the usefulness of cross-sector comparisons, because the importance of dividends differs widely across industries.
The comparison within sectors helps traders to have a better understanding of what constitutes an appealing yield. A yield higher than the industry average may be an indication of strength and confidence; a spike in yield due to falling prices can be a sign of risk. Sector-level comparisons allow traders to ground expectations and avoid false signals and establish opportunities that are consistent with both short-term tactics and overall market conditions.
Real-World Applications in Day Trading
Subtle cues that can start momentum are often sought by day traders and indicated yield can bring just that when it is tied to true market events. In February 2025, General Motors (NYSE: GM) increased its dividend by 25% and an additional buyback of 6 billion dollars. The action brought its indicated yield higher and saw shares rise almost 5 percent in pre-market trading, providing a near-term catalyst.
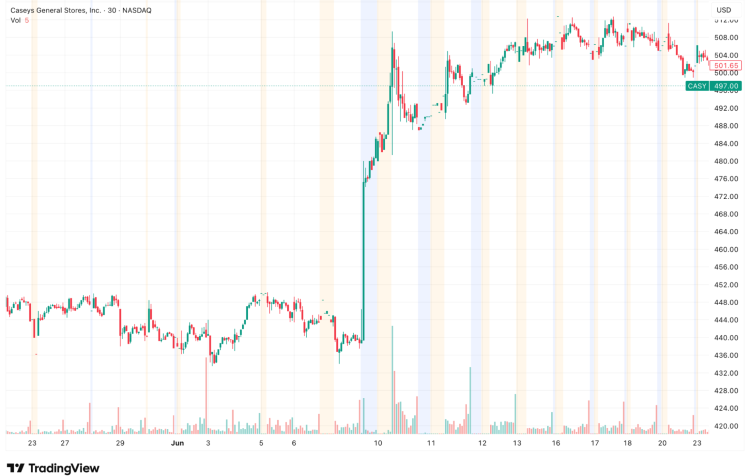
A good example was that of Casey General Stores (NASDAQ: CASY). Following the beating of earnings estimates and the increase of its dividend by 14 percent, the stock hit a new record. That move to a new high in yield provided an immediate entry opportunity to traders seeking to capture income-linked momentum.
Indicated yield can be useful in and around ex-dividend dates. A steep price decline that drives yields into double-digit territory can be an indication that volatility is on the way and traders may want to adjust.
On a larger scale, when several firms in an industry increase or maintain dividends, it signals that something is shifting—usually that investors are becoming more interested in income than in growth. By integrating these insights into watchlists and pairing them with technical setups, day traders can enhance their chances of tapping into the short-term opportunities that are connected to dividend-related movements.
Conclusion
The indicated yield does not only measure dividend returns, rather it is something that the market sees regarding stability and the potential income of a company. To traders, it provides a forward-looking view that can reveal opportunity or raise red flags during dividend events, especially when evaluating cash distributing stocks. The analysis of this metric will help provide another perspective on price changes and sentiment shifts.
Nevertheless, indicated yield alone should not be used. Its signal may be misleading because of price fluctuation, abrupt reduction of prices, or changes in a sector. Traders who combine it with technical charts, earnings, and sector analyses are in a better position to come up with sound judgments.
All in all, the usefulness of indicated yield is in bridging the gap between fundamentals and short-term trading. It is a convenient way to connect the expectations about dividend volatility, dividend-stock screening, or sentiment and market action. When used in combination with other tools, it becomes an even sharper blade to a trader strategy.
Indicated Yield: FAQs
-
How Is Indicated Yield Calculated in Stock Trading?
Indicated yield is a computation of the most recent dividend per share annualized and divided by the existing stock price. Take, e.g., a dividend of a quarter per share, or 50 cents, per quarter, or 2 dollars per year. Dividing that by the stock price will give the indicated yield, which is one way investors compare dividend yields across different companies as prices change.
-
Why Is Indicated Yield Important for Day Traders?
Day traders are interested in indicated yield because a change can indicate a change in sentiment or volatility An increasing yield can indicate uncertainty over dividend continuity whereas a decreasing yield can be an indicator of faith in the price of the stock. Monitoring such activities is a way of predicting responses to announcements of dividends.
-
Is Indicated Yield the Same as Forward Dividend Yield?
They resemble each other but they are not identical. Forward yield is normally calculated on the basis of projected dividends as given by the company, whereas indicated yield is calculated as an annualized rate on the basis of the last declared dividend. Both are forward-looking, but with indicated yield based on actual payouts and not estimates.
-
What Risks Come With Relying on Indicated Yield?
The biggest risk is taking dividends to be constant, which is never the case. Companies are able to reduce or cancel payouts, which makes the yield deceptive. Fluctuations in price can also skew the value and provide traders with a false sense of stability, making dividend focused investments riskier if used without broader context.
-
Can Indicated Yield Predict Stock Price Movements?
Indicated yield in itself does not foretell prices, but it does affect investor responses. The declining prices can cause a sharp rise in yield which can cause a negative sentiment, or stable yield which can calm the situation. When combined with technical and market data, it can be rather useful in predicting short term movements.
All reviews, research, news and assessments of any kind on The Tokenist are compiled using a strict editorial review process by our editorial team. Neither our writers nor our editors receive direct compensation of any kind to publish information on tokenist.com. Our company, Tokenist Media LLC, is community supported and may receive a small commission when you purchase products or services through links on our website. Click here for a full list of our partners and an in-depth explanation on how we get paid.


