Understanding the H Model


All reviews, research, news and assessments of any kind on The Tokenist are compiled using a strict editorial review process by our editorial team. Neither our writers nor our editors receive direct compensation of any kind to publish information on tokenist.com. Our company, Tokenist Media LLC, is community supported and may receive a small commission when you purchase products or services through links on our website. Click here for a full list of our partners and an in-depth explanation on how we get paid.
When a company shifts from fast growth to maturity, how do you figure out what its dividend stock is really worth?
The H Model helps answer that. It’s a valuation tool that blends two realities: strong short-term dividend growth and a slower, steady rate over time. Instead of assuming growth suddenly stops, it reflects the gradual slowdown most companies experience.
For dividend investors, this means more accurate valuations and smarter decisions. Whether a tech firm is stabilizing or a consumer brand is reaching its peak, the H Model offers a clear way to judge fair value across changing growth stages.
- The H Model
- H Model Formula
- Why Use the H Model
- H Model vs Other Valuation Approaches
- Advantages
- Limitations and Criticisms
- Practical Use
- Calculating Tools
- Conclusion
- FAQs
Breaking Down the H Model
The H Model is an equity valuation method, similar to the Gordon Model, but which, unlike the Gordon Model, reflects the fact that companies don’t usually grow at a steady rate. It assumes that dividends will grow not at a constant rate but at a high rate for a period, and then at a stable rate. By combining the two phases, the model provides a realistic image of the evolution of dividends over time.
In effect, the H Model is based on the assumption that a typical company begins with high dividend growth which levels out evenly to a long-term sustainable rate. The H refers to the transition’s “half-life” which represents the halfway point between rapid growth and steady state. For example, a young company may pay out, say, 12% dividends for a number of quarters and then be closer to 4%. The model calculates the impact of this slowdown process on the stock’s intrinsic value.

Its strength lies in recognising the natural life cycle of the company. Innovation cannot be sustained and growth cannot last forever. By combining the short-term spike and the resulting long-term steady state, the H Model provides investors with a balanced model to determine whether a stock’s price is an accurate representation of its future earnings and dividend potential.
The Formula Behind the H Model
The H Model calculates the intrinsic value of a stock by aggregating the short and long term dividend growth into one equation. The formula is:

In this formula, D₀ is the current dividend per share, which is used as a basis for the calculation. r is the required rate of return, that is, returns expected by investors due to the riskiness of the stock. gS is the short-term growth rate, and gL is the long-term, stable one, which appears after the company has matured. The H factor is equal to the half of length of high growth period and characterizes the slow rather than the sharp reduction of growth.
Each element takes a critical component of the valuation process. The current dividend ties the model to real payouts and the required return ties the model to investor expectations. The two growth rates describe the evolution of the company from growth to maturity, and the H growth factor smooths the evolution.
By combining these variables together, the H Model acts as a connection between short-term optimism and long-term stability. It does not rely on the unrealistic assumption of perpetual growth, but rather reproduces how companies actually develop in real markets. The result is a more comprehensive look at the fair value of a given stock – one that takes into account both dividend potential as well as the rate of change that will determine future performance.
Why Investors Use the H Model
The H Model is used by investors aiming to value companies transitioning between stages of growth, especially those that have become established cash-distributing stocks. Many businesses experience rapid dividend expansion early on, but this pace gradually slows as they mature. Traditional valuation models often assume either constant growth or an abrupt shift, which rarely reflects how companies evolve in practice. The H Model solves this by modeling a smooth transition from high growth to a long-term steady rate.
This method is particularly valuable for companies that still have several years of high dividend growth ahead but cannot sustain it indefinitely. For instance, a company expanding into new markets may continue to raise its dividends for a while before leveling off. For investors building a strong dividend portfolio, the H Model helps represent this tapering phase accurately, offering clearer insight into how dividend income is likely to evolve over time.
Dividend investors need to value transition companies. The most promising prospects are companies that have come up in their early growth phase but have not yet reached full maturity. By weighing both short-term growth and long-term stability, the H Model provides a balanced approach to valuing a stock according to its future dividend potential. This makes it an indispensable instrument for investors who want a combination of income and sustainable growth.
Comparing the H Model to Other Valuation Approaches
In order to understand the H Model easily, one can look at it in comparison to more basic approaches like the Gordon Growth Model, often used in discounted dividend valuation. That model makes the (unrealistic) assumption that dividends grow at a constant rate forever. In reality, companies rarely move from rapid expansion to maturity overnight—they slow down gradually as they evolve.

The H Model corrects this by using two rates of growth and a transition period between them. Instead of a sudden change, it is a constant downward progression from a short-term high rate to a long-term lower rate. This smooth curve reflects the actual evolution of dividends and allows investors to better understand the value in a more granular manner. The result can vary significantly between an undervalued or overvalued position for a stock compared to constant-growth assumptions.
While the Gordon Growth Model remains a valuable tool for stable, mature companies with consistent dividend histories, the H Model offers greater flexibility for firms in transition. It bridges the gap between simplicity and real-world behavior—providing a more dynamic framework for income investing and for valuing companies that have moved past their high-growth phase yet still deliver above-average dividend expansion.
Advantages of Applying the H Model
The most powerful feature of the H Model is its ability to track the two periods of growth of a company, a fast dividend growth period and a slow transition to a steady long-term growth period. This makes it ideal for valuing mid transition firms, where dividend increases are slowing but not quite mature yet. By mixing these phases together the model reflects the way dividends evolve in the real world.
The model also provides a better picture of dividend sustainability. Instead of assuming a constant growth rate indefinitely, it recognizes that growth naturally tapers over time. This reflects real-world factors such as competition, market saturation, or slower innovation—as seen in companies like Apple, which has faced scrutiny over its pace of new product development even before trade pressures reshaped its supply chain. Yet this tapering does not eliminate the potential for short-term growth.
It helps investors to avoid the pitfalls of constant-growth approaches that misprice stocks by ignoring transitional states. By being balanced in both short term and long term optimism, it is a growth oriented as well as an income focused prospect. For dividend investors, the H Model offers a structured, data-driven approach to determining fair value as companies with shifting growth patterns, for which the system captures the complexity of the real world while remaining intuitive.
Limitations and Criticisms
The H Model has some significant disadvantages. Its accuracy depends upon the assumptions made about growth rates and the required return. Small changes in these inputs can dramatically swing the value estimated, making the model sensitive to investor expectations. Over estimation of short term growth or under estimation of discount rate can result in overly optimistic valuations.
Another problem is being able to estimate how long a company can sustain a higher growth rate before leveling off. The H factor—half the length of the high-growth period—is only an approximation. In reality, growth paths are rarely linear; recessions, new regulations, or heightened competition—such as the race in Arkansas to build a U.S. lithium hub against Chinese rivals—can abruptly alter a company’s trajectory. This uncertainty limits how precisely the model can mirror real-world outcomes.
Critics cite that, more flexible than the constant growth models, the H Model is still simplistic when it comes to complex business cycles. Many companies have more than one surge and a slowdown rather than just one slow taper. It also does not necessarily cover the change in capital structure, change in dividend policy or change in management decision that affects the payout. For this reason, the H Model is most useful as a part of a greater analysis toolkit – useful for perspective, but not a solution in itself.
Practical Use for Dividend Investors
The H Model is extremely useful to dividend investors who follow companies in the transition from explosive growth to more stable growth. These firms typically are part of industries where the cycle of products are aging, markets are nearly saturated, or momentum is generally slowing. The model has considered such stocks by taking into account the last few years of high dividend growth and the shift to steady, long-term increases.
Consider Kimberly‑Clark (KMB). The company has grown its dividend for decades but now wants mid to high single digit growth – a sign of maturity. With the H Model, an investor may quote a higher short term dividend growth rate that may reflect recent hikes, then decrease this rate to a lower long term rate that is more consistent with the company’s known profile of a consumer goods company.
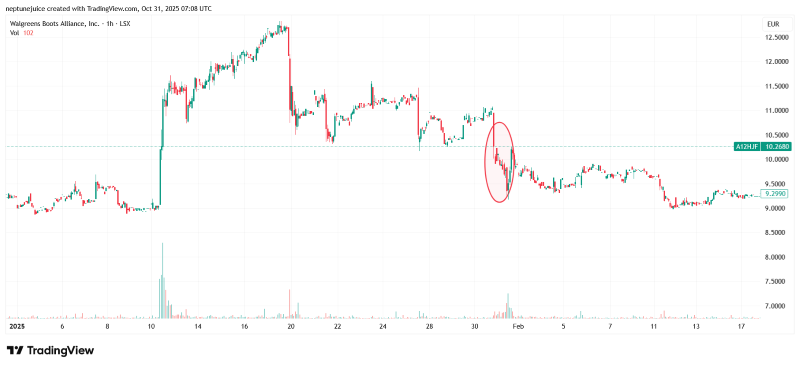
Also think about Walgreens Boots Alliance (WBA), which suspended its quarterly dividend amid turnaround efforts at the beginning of 2025 after years of steady payouts. The move reflected pressure to reallocate capital and refocus its business model. The H Model helps investors interpret this kind of shift—marking the end of a high-growth phase and the beginning of a stabilised or even contracting payout path.
By making realistic assumptions for short-term growth, long-term stability, and the H transition period, dividend investors can compare their valuations with simpler constant-growth models or insights from trusted stock recommendation providers. The H Model offers a balanced way to identify companies with slowing dividends that still have the potential to deliver reliable long-term income.
Tools for Calculating the H Model
The H Model is easy to use and does not require special computer software. However, accuracy requires correct facts and realistic assumptions. Most investors use financial calculators or spreadsheets (such as Excel or Google Sheets) to plug in some key numbers: the current dividend, the required rate of return, short-term and long-term growth rates, and the length of the high growth phase. These spreadsheets also allow the users to perform scenarios and observe immediately how slight changes in growth or discount rates impact the valuation.
If you require a more detailed analysis, there are many valuation programs and research platforms that are available with their own ready-made multi-stage model including the H Model. They save you time and allow you to compare the results to analyst estimates or industry benchmarks. Yet investors should understand the formula and not just rely on automated outputs.
Cross‑checking is essential. The H Model needs to be compared to other methods (e.g., Gordon Growth Model or discounted cash flow analysis) to ensure it is consistent. With multiple models you don’t become too confident on a single number, and have a more balanced understanding of the fair value. H Model ultimately is more dependent on disciplined testing and validity of assumptions than tool choice.
Conclusion
The H Model is useful for dividend investors valuing companies which are transitioning from rapid growth into stable, long term growing models. By bringing together both stages of growth in the same framework, it provides a realistic perspective on change in dividends over time.
Unlike simpler models that assume constant growth, the H Model captures the gradual slowdown most firms experience. It’s especially helpful for identifying undervalued dividend stocks—companies whose product cycles are maturing or whose expansion has steadied but whose dividends still grow at a healthy pace.
For the investor, the most important thing to remember is that the H Model is one tool among many. When used with solid assumptions and compared to other valuation methods, it can be used to help demystify whether a stock’s price reflects its future dividend potential, balancing income in the here and now with growth in the future.
H Model: FAQs
-
What Does the H Model Measure in Dividend Investing?
The H Model has the value of a dividend-paying stock measured by the sum of two phases of growth. It begins with an initial period of increased growth in dividends which slows down at some point and settles to a stable long-term growth rate.
-
How Is the H Model Formula Calculated?
The formula is: Value = [D₀ × (1 + gL)] ÷ (r – gL) + [D₀ × H × (gS – gL)] ÷ (r – gL). Here, D0 is current dividend per share, r is required rate of return, gS is short term growth rate, gL is long term growth rate and H is half the period of high growth rate.
-
When Should Investors Use the H Model Instead of the Gordon Growth Model?
Investors should apply the H Model when a company is making a transition from a high growth phase of development into a mature one. Unlike the Gordon Growth Model, which assumes that growth will remain constant, the H Model captures a gradual tapering of growth and is therefore more realistic for companies with tapering, yet elevated dividend growth.
-
What Are the Key Assumptions Behind the H Model?
The H Model assumes that the growth of dividends begins at a high level, then falls at a constant rate over time, and settles at a stable long-term rate of growth. It also assumes that investors know about the required rate of return and can reasonably estimate both growth rates and length of transition period.
-
What Are the Main Drawbacks of Using the H Model in Stock Valuation?
The model is very sensitive to assumptions regarding growth rate and discount rate. Predicting the duration of elevated growth is hard, and, in fact, companies may not follow a smooth tapering pattern. As a result, the H Model is best used in conjunction with other methods of valuation for a more balanced perspective.
All reviews, research, news and assessments of any kind on The Tokenist are compiled using a strict editorial review process by our editorial team. Neither our writers nor our editors receive direct compensation of any kind to publish information on tokenist.com. Our company, Tokenist Media LLC, is community supported and may receive a small commission when you purchase products or services through links on our website. Click here for a full list of our partners and an in-depth explanation on how we get paid.


