Gordon Growth Model: A Simple Guide for Investors


All reviews, research, news and assessments of any kind on The Tokenist are compiled using a strict editorial review process by our editorial team. Neither our writers nor our editors receive direct compensation of any kind to publish information on tokenist.com. Our company, Tokenist Media LLC, is community supported and may receive a small commission when you purchase products or services through links on our website. Click here for a full list of our partners and an in-depth explanation on how we get paid.
How do investors figure out if a dividend-paying stock is fairly priced?
One of the most common tools is the Gordon Growth Model (GGM). This model values a company based on the dividends it pays and assumes those payouts grow at a steady rate over time. For investors, it offers a simple way to judge whether a stock’s price matches its long-term dividend potential.
For traders, it shows how changing expectations—like higher dividend forecasts or shifts in required returns—can quickly move prices. Understanding the GGM helps both groups see how dividend trends shape stock value.
- The Gordon Growth Model
- Core Assumptions
- How the Gordon Model Connects to Day Trading
- Interpreting Results from the Model
- Advantages
- Limitations
- GGM vs. Valuation Models
- Practical Use
- Conclusion
- FAQs
Breaking Down the Gordon Growth Model
The Gordon Growth Model is one of the valuation techniques to calculate the fair value of the stock in terms of the expected future dividends. It presumes that a stock is worth whatever the future payments of that stock in the form of dividends will be at a uniform, predictable rate. Due to this emphasis, the model is most applicable to companies that have steady dividend trends and steady growth, and is therefore popular with analysts and dividend-oriented traders.
The formula is not complicated, Value = Dividend per Share / (Required Rate of Return-Growth Rate). Here, dividend per share is the amount to be paid to shareholders on an annual basis. The required rate of return is what investors desire to hold the stock, according to the conditions of the market and the risk expectations. The growth rate is the rate in which dividends rise. Investors can use these values to assess in a short time whether the stock is underpriced or overpriced against its market value.

The Gordon Growth Model is appealing because it is clear. It simplifies complicated valuation into a formula of dividends, growth and returns. To novices, it offers a simple model through which income potential can be used to inform value. To experienced traders, it acts as a quick test of whether market prices are in line with the expectations of dividend growth.
Core Assumptions of the Model
The Gordon Growth Model is based on a number of assumptions that render it easy to be used but at the same time reduce its accuracy. The former is constant dividend growth- in this model it is assumed that the dividends grow at a steady level forever. Although this is appropriate when dealing with established companies with fixed payout policies, it is not suitable in the case of companies with variable earnings, erratic cash flows, or fluctuating payout policies.
A second assumption is that the discount rate, or required return, will remain constant. This is compensation that is expected by investors on risk. In practice, the market environment changes- interest rates vary, investor moods change, and company risk levels change. A fixed rate does not capture these dynamics entirely, and thus this can cause valuations to fall short of the mark in volatile conditions.
The model also presumes a permanent time horizon in that dividends are valued as they will be perpetual. This makes projections simple but may not be realistic in industries that are disrupted, experience technological change or are regulated.
Such assumptions imply that the Gordon Growth Model, also known as the dividend discount valuation model, cannot be treated as an accurate prediction by traders and investors. In spite of its inflexibility it is still a useful tool when trying to understand the interactions between dividends, growth and required returns, particularly when applied to stable dividend paying firms.
How the Gordon Model Connects to Day Trading
Even though the Gordon Growth Model is geared towards long-term investors, it can be useful to day traders interested in short-term price fluctuations. The knowledge of the intrinsic value determination assists traders to predict market response to new data on growth or dividend expectations. A more dedicated pledge to a growth focused dividend strategy will tend to draw purchasing interest and momentum, whereas weaker guidance and/or decreases in dividend growth projections are likely to indicate lower intrinsic value and possible selling pressure.

It is also vital that the model be sensitive to discount rates. Perceived valuations can change rapidly as a result of changes in the economic conditions, including interest rate hikes or shifts in stock yield expectations. Recent debates among Fed officials about keeping focus on the economy despite political pressure show how closely markets watch these signals. Traders who are aware of such sensitivities can position themselves ahead of volatility, either on a momentum basis or by anticipating how investors will react to macroeconomic news.
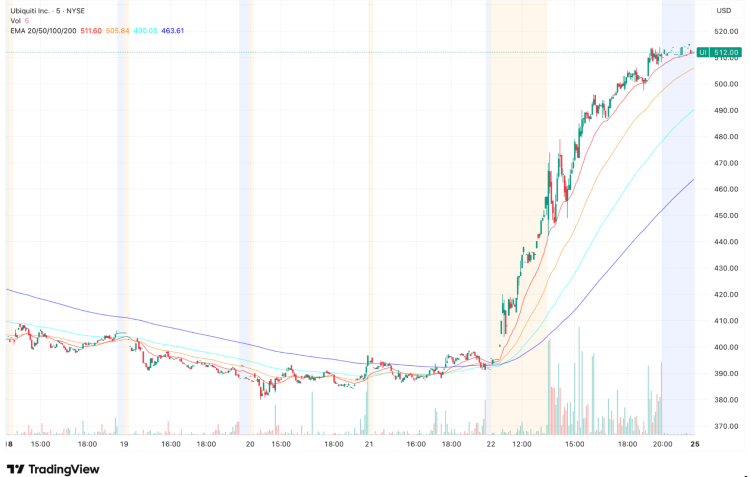
Day traders gain an advantage by factoring the Gordon Growth Model into a stock price analysis because they understand why dividend-related announcements tend to result in sharp price movements. Recent examples, such as Ubiquiti’s dividend hike that drove its stock up more than 20%, show how quickly markets react to payout news. Traders might not compute precise figures, but knowing how the model works helps them interpret sentiment shifts more effectively. The gap between long-run valuation theory and short-run trading techniques creates opportunities to exploit sudden fluctuations in expectations around dividends and growth.
Interpreting Results from the Model
Using the Gordon Growth Model will provide traders with a benchmark to identify undervalued/ overvalued shares. When the intrinsic value works out above the market price, the stock would be considered to be under priced and purchasers would be interested. When it is low, then the stock will be overvalued and more often than not, selling pressure or wary sentiment develops. These interpretations can be applied to the long-term investors as well as the traders in the hope of gaining short-term opportunities.
Dividend announcements have the tendency to serve as catalysts that alter the orientation of a stock against the model. An increase in the dividend or more positive growth prospects has the power to increase the fair value, which can in turn generate an immediate demand and volatility that gives the day trader an opportunity to take advantage of. On the other hand, reduced forecasts or reduced dividend rest the models and cause steep losses as the prices reprice to lower levels.
Such shifts may be magnified by analyst coverage, as dividend sustainability or growth-related upgrades and downgrades often reinforce or challenge the model’s findings. Recent picks from top Wall Street analysts highlighting dividend stocks for consistent returns show how strongly coverage can influence sentiment. Traders that monitor both intrinsic value-based signals and real-time news are better able to anticipate short-term shifts. By linking model outputs to market trends, they can identify when momentum is about to build, offering strategic entry and exit opportunities.
Advantages of Using GGM in Analysis
The primary strength of the Gordon Growth Model is that it is simple. In contrast to complicated valuation models that demand a long list of forecasts and a large number of factors, it involves only three variables-dividends, growth rate and required return. Such design renders it accessible to traders who are not financial modeling experts and yet provides a transparent method of determining whether the price of a stock matches its potential dividend. It is clear and can be used to make rapid estimates that can be incorporated into a wider analysis without being cumbersome.
What is also a strong point is that it concentrates on dividends, which is a concrete payback to shareholders. Whereas earnings are subject to fluctuations in the short-term, dividends reflect real cash that was sent to shareholders. This is one of the reasons why the model is particularly effective when applied to companies that have well-developed payout policies whose valuation reflects the amount of income that investors can expect to receive. This view will be helpful to those people who are focused on smooth returns as it is a reliable source of opportunity identification.
The model is projected, too, as it encourages traders to look ahead in terms of dividend increase, as opposed to focusing on the past performance. By taking into consideration how the payouts may rise in the future, the GGM allows the screening of dividend stocks to filter out chances that balance income generation and price appreciation. This forward lens can make it an effective tool in the hands of traders who want to play both short-term and be grounded in intrinsic value.
Limitations Traders Should Consider
The Gordon Growth Model is applicable in the valuation of dividend-paying stocks, but it has its limitations. It assumes that dividends increase at a constant rate forever, which usually does not occur. Firms adjust payouts based on earnings, market cycles, or strategy, making the model less reliable. It also uses a fixed discount rate that does not account for changes in interest rates, such as the recent signals from Fed Chair Jerome Powell that cuts may be coming, along with inflation and risk appetite, which are closely followed by credible stock advisory services.
The model is less practical with high-growth or cyclical firms which tend to have unpredictable dividend policies. In situations where the estimated growth rate approximates or passes the required return, it may even come up with unrealistic figures. This sensitivity also renders it less flexible than models that utilise broader measures or cash flow estimates, and should only be used with shares that pay regular dividends.
Day traders in particular cannot afford to use the GGM in isolation. Stock prices do not always move according to long run valuation but on technical patterns, sentiment and news. When properly utilized the model is recommended to be accompanied with techniques such as charting, volume and sentiment indicators where there is a balance between intrinsic valuation and market action in real time to facilitate decision making of trades.
Comparing GGM with Other Valuation Models
Gordon Growth Model is among several valuation models but what makes it distinct is that it considers dividends alone. The discounted cash flow (DCF) method, by comparison, estimates all the future cash flows and then discounts them back to the present. CF provides a larger scope of view but is complicated and very sensitive to assumptions concerning growth and discount rates as well as accuracy of cash flows. The price-to-earnings (P/E) ratio, in turn, gives a quick overview of how many dollars of earnings cost the investors. It is simple to use but does not directly measure dividend sustainability / shareholder returns.

In stocks that have a dividend focus, including many profit sharing stocks, the GGM provides a distinct advantage in that valuation is pegged to cash distributions. This is very attractive to traders and investors who care more about yield and stability of dividends. As opposed to the P/E ratio that quantifies earnings without indicating how they are spent, the GGM emphasizes dividends as the conduit between value and shareholder earnings. When compared to DCF, it is easier to apply—useful when markets move quickly and traders need faster insights.
Owing to these advantages, the Gordon Growth Model is more suitable to the manner in which many traders approach those companies that have predictable dividends, especially in those industries where stability and predictability are valued more highly.
Practical Use Cases in Trading Decisions
The Gordon Growth Model (GGM) is applicable in both the short-term and the long-term opportunities. It is common to find active traders using it to identify quick-moving opportunities pegged on dividend variations. As an example, Ubiquiti (UI), a networking-technology corporation, increased its dividends and granted a purchase-back of 500 million dollars. The increase in the share price rose by almost 23 percent as the market instantly reflected higher returns. An investor would input an increase in dividend growth in the GGM to reflect an increase in intrinsic value to further support a short term decision.
Traders will also have an opportunity to compare peers within a sector Unexpected special dividend in one firm and no change in another firm may make the GGM show the paying firm as underpriced. This can provide an edge around the sector-wide announcements, particularly when informed by insights of trusted financial advisory letters that reflect the changing payout policies.
The real time changes can mostly be as a result of analyst commentaries. Dow, as another example, reduced its dividend by 50 percent following low earnings, and the shares fell by more than 16 percent as the expectations were adjusted. The GGM modification of reduced payout instantly caused a drop in implied value, which assisted traders to expect selling pressure.
When GGM is reflected in watchlists, especially when businesses change their dividend predictions or adhere to a consistent dividend strategy, traders have a better understanding of market sentiment and are therefore able to find more accurate entry and exit levels in the short term.
Conclusion
The Gordon Growth Model provides traders and investors with an easy method to relate dividends with stock price. The ease in use is its advantage, so one can get a quick indicator of whether a stock appears to be undervalued or overvalued, based on dividend growth. To traders, it also presents an impetus of further anticipation of market response to dividend or sentiment changes.
The model alone however, should never be applied. Markets are dynamic and dividends tend to fluctuate in ways that elude the formula. When combining the GGM with technical analysis, and earnings reports, and other indicators, one is not overly dependent on one measure.
At the end of the day, the Gordon Growth Model is a source of insight but not of truth. It elucidates the place of dividends as a creator of value and gives valuable context in trading choices. Properly used, it can complement a more comprehensive approach, using a combination of fundamental analysis and real-time market data.
Gordon Growth Model: FAQs
-
What Is the Formula Used in the Gordon Growth Model?
The equation is Value = Dividend per share/ (Required rate of return- Growth rate). It estimates a stock based on the dividend growth at an unchanging rate permanently.
-
Can the Gordon Growth Model Be Applied To Non-Dividend-Paying Stocks?
No, the model is only applicable in the dividend-paying stocks. It only depends on the payment of dividends and growth and therefore companies that do not pay dividends cannot be valued using GGM.
-
Why Is the Gordon Growth Model Useful for Day Traders?
Although conceived as a long-term indicator, GGM can highlight the upbeat or downbeat impact of dividend announcements or growth expectation shifts on short-term sentiment. Day traders may also use it to anticipate volatility when firms announce dividend increases, dividend cuts, or policy changes, particularly when aligning the model with an ex dividend trading strategy.
-
What Are the Biggest Limitations of Using the GGM?
This model presumes constant dividend growth, constant discount rate and also infinite time horizons all of which are unrealistic in the dynamic markets. It is not as dependable on its own since it is incompatible with companies that have variable or irregular dividends.
-
How Does the Gordon Growth Model Differ From Discounted Cash Flow Analysis?
GGM is a more specific tool as it does not look at debt. Discounted cash flow (DCF), in contrast, looks at all the future cash flows of a company and not just the dividends. This renders DCF more detailed, but also more complicated.
All reviews, research, news and assessments of any kind on The Tokenist are compiled using a strict editorial review process by our editorial team. Neither our writers nor our editors receive direct compensation of any kind to publish information on tokenist.com. Our company, Tokenist Media LLC, is community supported and may receive a small commission when you purchase products or services through links on our website. Click here for a full list of our partners and an in-depth explanation on how we get paid.


