Mastering the Dividend Growth Rate Formula


All reviews, research, news and assessments of any kind on The Tokenist are compiled using a strict editorial review process by our editorial team. Neither our writers nor our editors receive direct compensation of any kind to publish information on tokenist.com. Our company, Tokenist Media LLC, is community supported and may receive a small commission when you purchase products or services through links on our website. Click here for a full list of our partners and an in-depth explanation on how we get paid.
Want to know if a company’s payouts are truly keeping pace with its growth?
The dividend growth rate formula gives you a clear way to measure how quickly dividends are rising year over year. For investors, a steady climb signals strong fundamentals and long-term value. For traders, sudden shifts in growth rates often trigger sharp price moves worth capitalizing on.
By breaking dividend growth into simple numbers, this formula helps cut through noise and spot both opportunity and risk. Mastering it means seeing beyond the payout itself to the momentum driving a company’s performance.
- Defining Dividend Growth Rate
- The Formula Explained
- Why Traders Follow Dividend Growth
- Various Growth Rates
- Historical Growth vs Growth Estimate
- Advantages
- Limitations and Risks
- Practical Use
- Conclusion
- FAQs
Defining Dividend Growth Rate
The dividend growth rate is an important financial metric that measures the rate at which a company’s dividends increase over time. Expressed as an annualized percentage increase in dividend payments over a specified period of time (typically three, five or 10 years), it indicates the rate at which a company is increasing cash returns to shareholders. This is reflective of not only profitability, but management’s willingness to reward investors. Because it is reported as a percentage, it makes easy comparisons between companies and sectors, irrespective of their size and time frame.

This is a useful measurement of how sustainable a company’s payout policy is. A steady or increasing growth rate indicates earnings strength and consistent growth, whereas a flat or negative growth rate may indicate financial weakness. Long-term investors tend to use it as a way to find consistent sources of income, while traders may watch shifts in the growth rate as an early indicator of sentiment changes that may drive short-term price action—as seen recently when two major banks boosted their dividends, drawing comparisons with peers on how their increases stack up.
The real strength of dividend growth rate is that it can tie short-term market signals to longer-term trends. It captures how management has dealt with payouts in the past and helps frame the question of whether current dividend policies are likely to persist. For traders, it puts dividend announcements into perspective and refines expectations of how markets could react to payout changes when they are announced.
The Formula Explained Step by Step
The dividend growth rate is calculated using a straightforward formula that captures the pace of dividend increases on an annualized basis. The formula is:

There is a specific purpose for each ingredient in the formula. The Recent Dividend is the most recent annual dividend per share, generally taken as the sum of the four most recent quarterly payouts or the annual amount as stated. The Past Dividend is the per share dividend from the first year of the selected period. The Years input is the count of years between those two points. The total growth multiple is the result of dividing the recent dividend by the previous dividend. Multiplying this result by one divided by the number of years and taking the result to the power of one divided by the number of years distributes the growth equally, which is the effect of compounding. Subtracting one gives the figure in annual percentage growth rate terms.
For example, if a company’s dividend grew from $1.00 to $1.46 over four years, the calculation would be:
(1.46 ÷ 1.00)^(1 ÷ 4) – 1 = 0.099, or about 9.9% per year.
This approach removes volatility from the dividend change and provides investors and traders with a reliable momentum metric that is based on the steady annual rate of change of the dividends. It makes it easy to compare different companies and gives insight into payout sustainability.
Why Traders Follow Dividend Growth
Dividend Growth is typically considered as a long-term indicator of financial strength, but it still pays off for short-term traders to keep an eye on. When a company reports accelerated or stable growth, that is a message of confidence that can immediately generate buying interest and drive up prices as investors respond to the signal. When the company’s growth rate slows or management suggests a pause in growth, the market tends to interpret it as a warning against future earnings and selling pressure can quickly ensue.
To day traders, these shifts open up fleeting periods of volatility. Dividend announcements often arrive alongside earnings reports or guidance updates, which can amplify reactions. A faster-than-expected increase in growth might drive momentum higher, while a smaller-than-expected increase—or a cut, such as when Dow forecast weaker sales and slashed its dividend amid tariff uncertainty—can trigger sharp declines. By keeping an eye on growth rates and the timing of announcements, traders can position themselves to ride these bursts instead of chasing them.
Watching dividend growth is also a good way to gauge the reaction of various investors. Income investors might buy more shares after a better payout occurs, while growth investors might step on the brakes if the dividend increase indicates less reinvestment. Traders who understand these cross currents can time their entries and exits more accurately, converting what is normally a long term measure into a short-term catalyst.
Understanding the Various Growth Rates
A company’s dividend growth rate reflects a great deal about the fundamental health of a company, which is why it’s important for traders to read these signals. A high or steadily increasing rate usually suggests strong earnings, disciplined capital allocation and management confidence. That message is often rewarded by immediate demand in the market, and while dividend growth is a long term theme, a better than expected update can trigger a short term rally.
Slow or stagnant growth is a source of concern. If payouts have been flat for several years, it can signal tighter margins or fewer opportunities. Reactions may be less dramatic but the signal still matters. Negative growth, however, has the strongest impact. A dividend cut is widely seen as a sign of strain and can spark rapid selloffs—much like the recent tech stock selloff that rattled confidence in the AI trade and underscored how quickly markets can turn when sentiment shifts.
For active traders the key is to relate the number to perception. An increasing rate can attract income-oriented investors and boost near term demand. A negative or very low rate can encourage traders to short their exposure rapidly. By linking the growth rate to potentially changing sentiment, traders are able to anticipate changes in momentum and strategize trades around the volatility that results. In practice, it is not so much the formula itself that is important as it is how the update will be interpreted by different parts of the market.
Historical Growth vs Growth Estimate
There is an important distinction to be made between measuring what has happened and estimating what is to happen next. Historical dividend growth is based on actual data and shows how much the payouts have grown over a selected period. This history of performance is used by traders and investors to determine reliability, and whether management has consistently increased value or caused uneven growth. Markets are attracted to a long history of consistent growth both in the long-term and short-term because it implies stability.
Projected growth is forward looking and based on expectations. Estimates for future increases are made using models of the analyst and company and the prevailing sentiment. Traders can place orders for an expected move, which shifts the price before an official announcement. If expectations are for accelerated growth, shares may rise before the release of the results. If expectations reset early in anticipation of a slowdown, a growth drag effect may show up earlier.
For day traders, both views are powerful. History highlights companies that have built trust, while projections create speculative trades. By watching analyst revisions, guidance language, and timing around earnings—as when top Wall Street analysts singled out dividend stocks for steady returns—traders can better anticipate where volatility is likely to strike. Often the market reacts just as strongly to expectations as it does to what has already occurred.
Advantages of Using Dividend Growth Rate Formula
The dividend growth rate formula is simple but powerful. With only three inputs—recent dividends, past dividends, and a time horizon—it produces an annualized growth rate that’s easy to interpret. For day traders, speed matters, and this quick calculation offers a snapshot of dividend trends without needing complex models. That speed makes it useful for timing entries or exits around dividend news as part of broader dividend trading strategies.
The second strength is comparability. By expressing growth as a percentage rate, it allows traders to conveniently compare companies across industries or within the same industry. This helps to show the areas of increased momentum and narrows the search for trade opportunities. A company that has high growth in payouts for several years in a row may be more marketable than one with stagnant or declining dividends, and the formula makes those comparisons easy.
The metric also ties into valuation models such as the Gordon Growth Model, which use dividend growth to calculate intrinsic value and support dividend based stock pricing. Even short-term traders benefit from recognizing this connection, since changes in growth assumptions can shift sentiment and move prices quickly. By offering clarity, comparability, and integration with valuation tools, the formula helps traders turn dividend signals into actionable insight.
Limitations and Risks of the Formula
Useful as it is, there are obvious limitations to the dividend growth rate formula. It makes the assumption that dividends increase at a uniform and constant rate, which is almost never the case in the real markets. But actual growth patterns are much harder to predict, because payouts vary with earnings, strategy, and general conditions. Over-reliance on the formula is dangerous in making false assumptions about future performance.
The formula is also based on the regular payouts. It is a good measure if dividends are consistent in their growth, but if dividends are cut, suspended, or distributed in an irregular manner, the results of this measure would be skewed. One reduction can significantly change the prognosis, but the formula does not take sudden fractures into account. For traders, this means it can be a deceptive indicator that doesn’t trigger important red flags without being used in conjunction with more general analysis or insights flagged by expert investing bulletins.
Another problem is that it is narrow in its coverage. The formula does not consider variables such as tax rates, sentiment, debt or cash flow, which have a more direct impact on dividend decisions than historical averages. For active traders, these omissions are important. The dividend growth rate should be regarded as one of several tools, used in conjunction with technical indicators, earnings reports, news and events, as well as guidance from trusted stock recommendation providers.
For example, when Broadcom earnings were heading directly in the opposite direction of its rally traders were more sensitive to momentum and expectations than any historical dividend pattern. By maintaining the context of the formula, traders are prevented from becoming falsely confident and better align strategies with the realities of fast-changing markets.
Practical Use in Day Trading Context
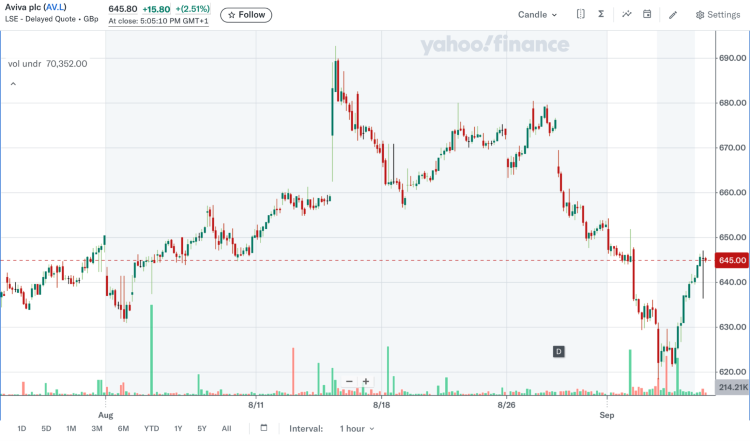
Dividend growth announcements usually come with strong intraday movements, making them very valuable to day traders. For instance, Aviva (AV.L) recently increased its interim dividend by 10% following a 22% increase in earnings for the first half of the year, which pushed its shares to a 17-year high and attracted short-term speculators who are willing to hitch a ride on the momentum. By contrast, slower-than-expected growth often sparks sell-offs, creating volatility that nimble traders can exploit. These moves can also shift investor focus toward income generating shares that offer both short-term momentum and consistent payouts.
Smart day traders pay close attention to earnings calls and payout announcements. Many times stocks move before the official news comes out, due to management signals regarding future policy. Analyst expectations are also important: when growth is better than expected, shares can be positive; when results fall short, downside volatility is likely to ensue.
Some strategies include using an ex-dividend trading strategy, monitoring ex-dividend dates, setting up alerts for dividend news, and pairing volatility indicators with technical patterns. Tools like the dividend growth rate formula add context by showing whether a move reflects an established trend or an unexpected break. Traders also weigh how longer-term investors approach payouts—for example, whether dividend gains are taken as cash or follow a reinvested dividend approach that compounds over time. Used properly, dividend announcements can become precise catalysts for short-term trades.
Conclusion
The dividend growth rate formula is a straightforward yet powerful tool for monitoring payout growth and understanding a company’s financial resilience and management confidence. Its true value for the trader is in identifying changes in sentiment that is the cause of short-term volatility.
But it should never be used on its own. Market conditions, earnings, and company policies can throw many a wrench into steady growth assumptions. Combining the formula with technical signals, news flows, and sector analysis helps to avoid pitfalls and uncover real opportunities.
Dividend growth is ultimately a bellwether and a trading catalyst. When used as part of a larger system, it provides traders with a clearer edge over other trading systems in terms of predicting reactions and positioning.
Dividend Growth Rate Formula: FAQs
-
How Do You Calculate the Dividend Growth Rate Formula?
The dividend growth rate is calculated using the formula:
Dividend Growth Rate = (Recent Dividend ÷ Past Dividend)^(1 ÷ Years) – 1.
This indicates the yearly percentage growth in dividends for a particular period of time. For instance, if a company's dividend increased from $1.00 to $1.50 over a period of five years, you would plug those numbers into the formula and you would get the average annual growth rate.
-
Why Is the Dividend Growth Rate Important for Traders?
Dividend growth is a strong indicator of company health and management’s confidence in future earnings. Traders can use it to capture volatility: announcements of faster or slower growth often push stock prices up or down in the short term. Tracking this rate also helps traders anticipate shifts in sentiment, especially when comparing it with share income yield or reactions to earnings calls and dividend updates.
-
Can Dividend Growth Rate Predict Stock Price Movements?
It doesn’t predict exact price swings, but it serves as a useful signal. Rising earnings and payouts tend to attract buyers, while stagnation or decline can trigger sell-offs. Traders often view it alongside other measures to gauge how markets might respond, particularly in stocks with cash payouts where dividends are a primary focus.
-
What Is the Difference Between Historical and Projected Dividend Growth?
Historical growth looks backwards and indicates how dividends have increased over time. Forward-looking growth is based on analyst forecasts or company guidance. Markets usually react very strongly to projections because they create expectations about the future performance.
-
Is a Higher Dividend Growth Rate Always Better?
Not necessarily. A higher rate is a sign of strength, but may be unsustainable if it is growing faster than earnings. Traders and investors need to ask if the growth was on the back of fundamentals or if it is likely to result in cuts in the future that will harm both income streams and stock prices.
All reviews, research, news and assessments of any kind on The Tokenist are compiled using a strict editorial review process by our editorial team. Neither our writers nor our editors receive direct compensation of any kind to publish information on tokenist.com. Our company, Tokenist Media LLC, is community supported and may receive a small commission when you purchase products or services through links on our website. Click here for a full list of our partners and an in-depth explanation on how we get paid.


