How Dividend Investors Can Use Cup and Handle to Identify Long-Term Entry Points


All reviews, research, news and assessments of any kind on The Tokenist are compiled using a strict editorial review process by our editorial team. Neither our writers nor our editors receive direct compensation of any kind to publish information on tokenist.com. Our company, Tokenist Media LLC, is community supported and may receive a small commission when you purchase products or services through links on our website. Click here for a full list of our partners and an in-depth explanation on how we get paid.
Which chart pattern can show you when a stock is ready for a strong move higher?
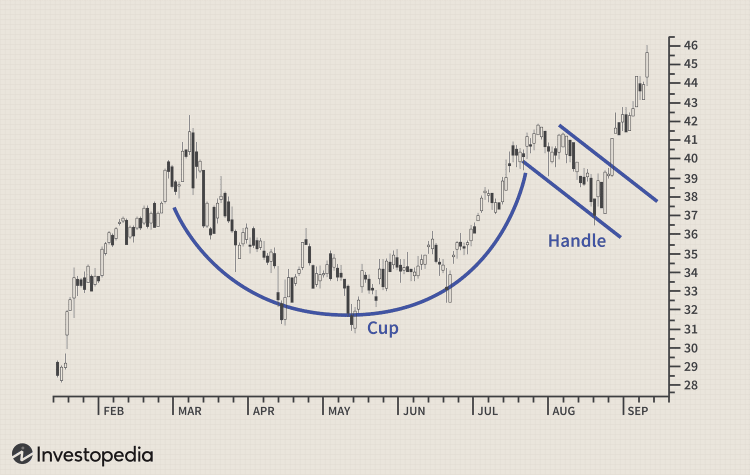
Many traders turn to the cup and handle. This formation is easy to spot: a rounded “cup” forms after a pullback, followed by a smaller dip called the “handle.” When the handle breaks upward, it often signals a fresh rally. For dividend investors, that signal can be even more powerful, pointing to entry points where steady income meets strong price action.
Whether you trade actively or focus on long-term dividends, the cup and handle offers a clear way to time opportunities with more confidence.
- Definition
- The Psychology Behind the Pattern
- The Cup Shape
- The Handle Formation
- Using with Dividend Stocks
- Advantages
- Risks and Limitations of the Pattern
- Tools and Indicators
- Conclusion
- FAQs
Defining the Cup and Handle Pattern
The cup and handle pattern is a chart pattern that indicates the possibility of a continuation of an upward trend. It starts with the “cup” which is a rounded bottom after a stock has gone down, but then slowly recovers forming a U shape. This stage represents a stage of consolidation, as selling pressure is released, buyers gain control and the stock stabilizes before moving forward. The rounded shape is important as it indicates a steady recovery instead of a sharp recovery, which gives more credibility to the setup.

Next comes the “handle,” which is a smaller, short term pullback that moves slightly lower or sideways. This phase is when there is a pause as traders take profits or are wary before committing to a breakout. It is consolidation at the end before the momentum changes to higher. When the price breaks through the resistance level (the rim of the cup) it indicates the beginning of a new bullish trend, often accompanied by an increase in trading volume.
Traders like the cup and handle pattern because it combines consolidation and breakout action. It shows the resilience of a stock to absorb selling pressure, build a strong base, and then push higher as confidence builds—much like analysts recently noted the need for consolidation before stocks retest all-time highs. For dividend investors, the pattern is particularly useful as it marks entry points where technical momentum combines with steady income to provide the opportunity to capture both growth and dividends.
The Psychology Behind the Pattern
The psychology of the cup and handle is how investors change from being cautious to being confident. At the formation of the cup the market is rebounding from a decline, and many players are still wary. Selling pressure dissipates as the value buyers and long-term investors start to accumulate, seeing lower prices as attractive. This steady demand forms the rounded bottom and indicates that confidence is returning and the worst of the decline is likely over, a shift often noted in leading stock market newsletters.
As the price gets closer to the rim, optimism builds but caution remains. The handle is created as some investors take profits or wait for better confirmation. This small dip in prices is a test of conviction, with weak hands falling away and strong buyers setting up for the next move. The pause is also useful in helping to clear the way of resistance, paving the way for a sustainable breakout—an approach emphasized by many reliable market advisory services.
For dividend stocks this psychology holds especially true. Income-focused investors will frequently buy during the cup phase, when they can take advantage of value pricing along with dependable payouts. The handle reflects hesitation before the broader market comes to recognize both dividend stability as well as price potential. When the breakout occurs, it represents a change in the collective sentiment, when traders and investors are aligned to the twin attractions of steady income plus growth, which generates strong upward momentum.
Identifying the Cup Shape
The cup in the cup and handle pattern occurs after a decline in a stock and then the stock finds its bottom. Instead of dropping sharply and rebounding in a v-shape, the price action rounds out in a U-shape base. This structure is a signal that selling pressure has abated and yet buyers are cautiously stepping back in. The gradual bottom is important, as it indicates steady accumulation, not a quick rebound that may not have staying power.
A valid cup typically has a smooth curve: the left side represents the decline, the bottom the stabilization and accumulation and the right side a gradual recovery towards previous highs. If the pattern is jagged, or if it forms too quickly, it may not be as reliable as if it is more of a slow swing, which indicates uncertainty. Depth is also important—cups that are too shallow may not generate enough momentum, while cups that are too deep may be perceived as a sign of weakness.
To traders, the cup shape shows the health of the stock at its roots. It proves that selling pressure has been absorbed by the market, and it is gearing up for a possible breakout. In dividend-paying stocks this phase is often coupled with investors buying at lower prices to get higher dividend yields, reinforcing support. Spotting a proper cup helps traders spot the handle and prepare for breakout opportunities.
Recognizing the Handle Formation
After the rounded cup forms, the next phase is the handle which manifests itself in the form of a short term pullback near prior resistance. Instead of immediately breaking out, the price usually pauses and moves slightly lower or sideways forming a smaller consolidation zone. This is one where some investors are taking profits near previous highs, which adds some mild selling pressure. The handle is the last hesitation before more significant buying action develops. In mid-April 2025, NVDA stock illustrated this setup well, as the company reported strong Q1 fiscal 2025 earnings even as export licensing issues for its H20 chips introduced headwinds.

Handles are smaller than the cup, and should be formed within the upper third of the range. A pullback which goes too deep may signal weakness, whereas a shallow order handle often sets the stage for a strong breakout. Traders prefer this setup as the narrowing price action forms an obvious point of breakout above resistance.
From a trading perspective, the handle will provide good entry opportunities. When the stock pushes out of the handle on heavy volume, this shows renewed buyer interest and the potential for a sustained move higher. For dividend investors, identifying the handle is also useful—it represents instances when momentum and steady income converge, which is useful for time entries. In essence, the handle is the starting point which converts consolidation into continuation of the bullish trend.
Using the Pattern with Dividend Stocks
Dividend investors often look at stability and long-term return, but the cup and handle can provide some insight into optimizing entry points. When this pattern occurs in a dividend-paying stock it indicates the market has been through a correction and accumulation and is about to break out. For income-minded investors, this presents an opportunity to buy in when upward movement could coincide with dependable payouts and align with dividend-based stock pricing.
By using the pattern, dividend investors are able to combine income objectives and growth potential. Rather than buying on every dividend announcement, they can wait for the handle to finish and the breakout to confirm and get in at a point where both capital appreciation and dividends work to enhance returns. This way, you may also reduce the risk of purchasing in times of weakness or stagnation, a method that also supports strategies like quick payout investing.
For traders who focus more on income, the cup and handle can be extremely useful when looking at good dividend stocks that have temporarily fallen behind but still have good fundamentals. A confirmed breakout is a great reinforcement that dividends will continue and that capital growth may come. This confluence of technical momentum and income potential makes the cup and handle a valuable tool to dividend investors looking for steady income flow with upside potential.
Advantages of Trading the Cup and Handle Setup
The cup and handle pattern is considered to be one of the more reliable of the technical setups because it is formed in a steady accumulation and is often followed by sustained momentum. One of the main benefits is that it is easy to understand – both the cup and handle are clear to identify and the setup is accessible to traders at different levels of experience. This clarity also gives well-defined breakout points, which allows traders to set entry and exit targets with more confidence.
Another of its strengths is that it has a historical track record of signaling bullish continuation. Unlike less structured patterns, the cup and handle implies a logical sequence of investor behaviour: correction, stability, mild pull back and break out. This progression provides direction and measurable goals, and often correlates the projected gains with the depth of the cup. For traders, it provides a structured way of managing risk and sizing positions.
Dividend investors enjoy other benefits. Timing entries with this pattern can be used to increase returns by combining price appreciation with steady income. Instead of buying too early, they can wait for confirmation, which maximises upside while locking-in long-term yields. The cup and handle’s combination of reliability, defined targets and applicability to both growth and income strategies makes it a great tool for traders and dividend investors alike.
Risks and Limitations of the Pattern
Although the cup and handle is known to be reliable, there are risks traders need to consider. One common pitfall is the false breakout: a stock may appear to complete the pattern, only to reverse and trap aggressive entries. This risk grows in volatile markets or when breakout volume is weak, which is why confirmation signals are essential—especially with warnings that today’s calm market could give way to a far more volatile fall.
Misidentification is another problem. A valid cup needs a smooth and rounded bottom, but traders often confuse sharp V-shaped recoveries with cups, and this makes a cup less reliable. Likewise, handles that form too deep or last too long may not be healthy pullbacks, and will result in weak signals. Such misreads, in turn, often lead to ill-timed trades.

The greatest limitation is relying only on technicals without considering fundamentals. For dividend investors, a bullish pattern means little if payouts are unsustainable or cash flow is weak. Recent examples, like Whirlpool being downgraded after poor results and a dividend cut, show how quickly income stability can erode. Dividend reductions or sector headwinds can undermine even a textbook setup. Combining the Cup and Handle with checks such as payout ratios, earnings stability, and industry trends helps filter out false opportunities.
By being aware of these risks, and utilizing complementary tools, the trader can minimize the risks and increase the chances of making the pattern a profitable addition to their strategy.
Tools and Indicators to Confirm the Pattern
Spotting a cup and handle pattern is only the first step – confirmation is critical in order to avoid false signals. Volume analysis is one of the most important tools. Ideally, volume should be falling when the cup and handle are forming, then exploding when the stock breaks above the resistance. This jump implies that the breakout is well supported by strong buying interest and not just short-term speculation.
Moving averages are also weighted. When a stock breaks out above the 50-day moving average or 200-day moving average, it reinforces the momentum to the buyers. For dividend investors, a breakout that is supported by long-term averages can indicate that the company in question is income-producing and will likely remain so for some time.
Momentum indicators such as the Relative Strength Index (RSI) and MACD give further confirmation. An RSI moving out of neutral territory or a MACD crossover moving in conjunction with the breakout can be green lights to traders.
Using these tools in conjunction with each other ensures that investors are not basing their decisions on the shape of the pattern, but rather, on broader signals for stability and growth of dividends. This disciplined approach helps to improve the chances of making profitable moves while reducing costly missteps.
Conclusion
The cup and handle is one of the most recognizable bullish continuation patterns in technical analysis. Its rounded base and short pullback make it a clear signal for potential breakouts. For dividend investors, it adds confidence when timing entries into stable, income-generating stocks showing upward momentum.
Still, the setup is not foolproof. False breakouts, weak formations, or broader market pressures can reduce its reliability. That’s why confirming signals with volume, moving averages, and momentum indicators is critical before committing capital. Discipline and patience often separate successful breakout trades from premature entries.
By understanding both its strengths and limitations, traders can use the cup and handle more effectively. Whether applied to short-term momentum plays or long-term dividend strategies, it provides valuable insight when combined with other analysis. Ultimately, it should serve as one part of a broader toolkit that balances technical signals with fundamental stability.
Cup and Handle Pattern: FAQs
-
What Does the Cup and Handle Pattern Indicate in Trading?
The cup and handle pattern is a bullish continuation pattern. It indicates that after a period of consolidation and a minor pullback, buyers are likely to take back control, which will lead to a breakout and upward price momentum.
-
How Can Dividend Investors Use the Cup and Handle Setup?
Dividend investors can use this pattern to time entrance into income producing stocks. When the pattern points to a probable breakout it offers the opportunity to buy up stable dividend paying companies at points of renewed upward movement, combining growth with a steady income.
-
What Is the Difference Between the Cup and the Handle Phases?
The cup is a gradual bottoming pattern following a decline in which the stock stabilizes and begins to recover. The handle forms afterwards as a short term pullback or consolidation before the stock makes a breakout to new highs.
-
Are Cup and Handle Patterns Always Reliable?
No, the pattern is not always a reliable one. False breakouts or poorly formed setups can result in losses if traders get in too early. That's why it's so important to get confirmation with other indicators and also manage risk carefully.
-
What Indicators Help Confirm a Cup and Handle Breakout?
Traders commonly refer to volume spikes, to confirm buying interest; moving averages, to ensure that you are in line with the trend; and momentum indicators, such as the RSI or the MACD, to assess strength. These tools are helpful in validating if there is a breakout supported with strong participation from the market.
All reviews, research, news and assessments of any kind on The Tokenist are compiled using a strict editorial review process by our editorial team. Neither our writers nor our editors receive direct compensation of any kind to publish information on tokenist.com. Our company, Tokenist Media LLC, is community supported and may receive a small commission when you purchase products or services through links on our website. Click here for a full list of our partners and an in-depth explanation on how we get paid.


