Free Financial Stock Images and Infographics
Looking for free finance images and infographics? From investing, to personal finance, to credit repair—the images below are free to use. It's all part of The Tokenist's mission to build a better financial future—for all of us to share. ????
Free Finance Images
All we ask is that you provide a citation to tokenist.com. Our designers have worked hard to build these—a little attribution can go a long way. ????

Types of Investments in a Brokerage Account
This image shows how investing through a brokerage account can involve stocks, bonds, mutual funds, REITs, and more.
Download
Difference Between Growth Stocks and Value Stocks
This image depicts the crucial differences between growth and value stocks.
Download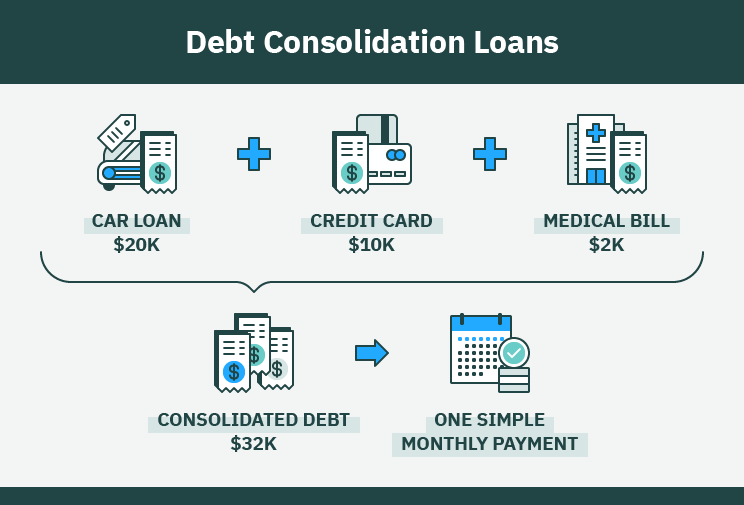

A Basic Diagram of How A Bond Works
This image illustrates the functionality of a bond, include the principal and interest.
Download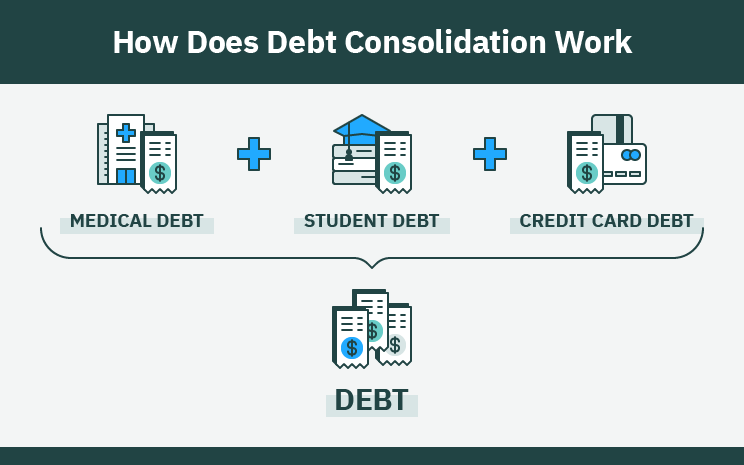
How Does Debt Consolidation Work
This image articulates shows the process of debt consolidation.
Download
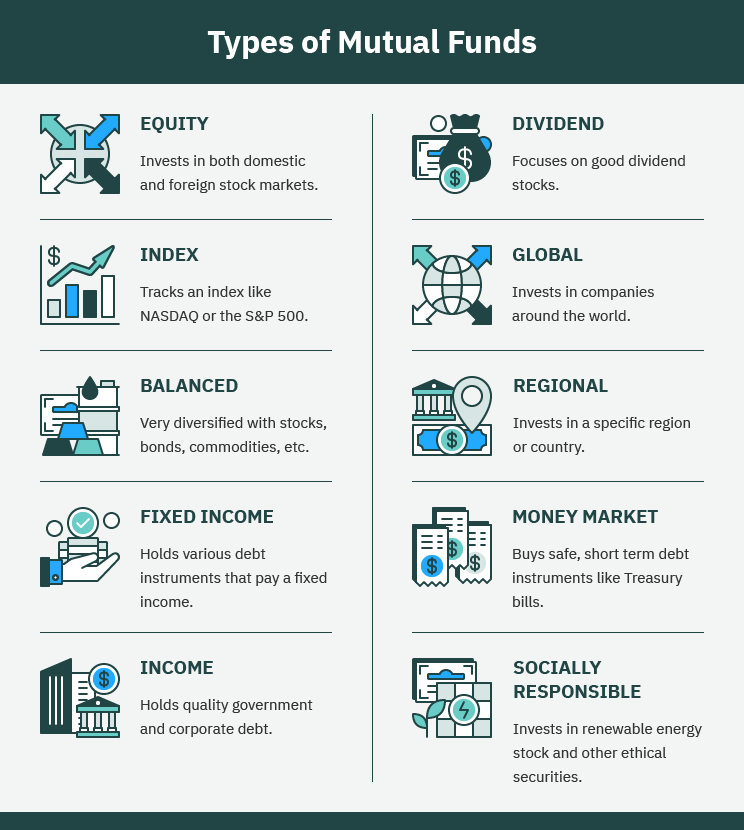
Stocks vs. Mutual Funds
This image explains the difference between stocks and mutual funds.
Download

Similarities and Differences Between Stock Options and Stocks
This image portrays the difference between stock options and stocks.
Download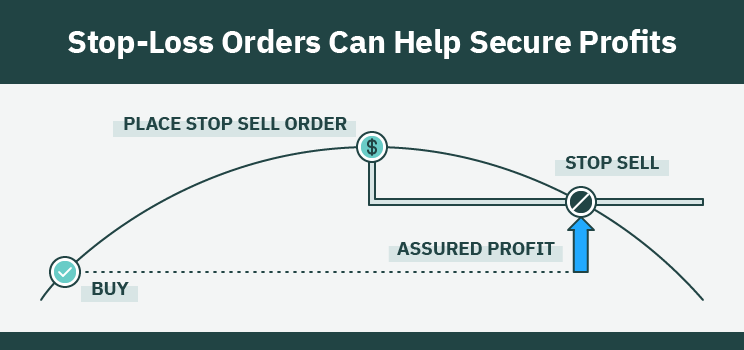
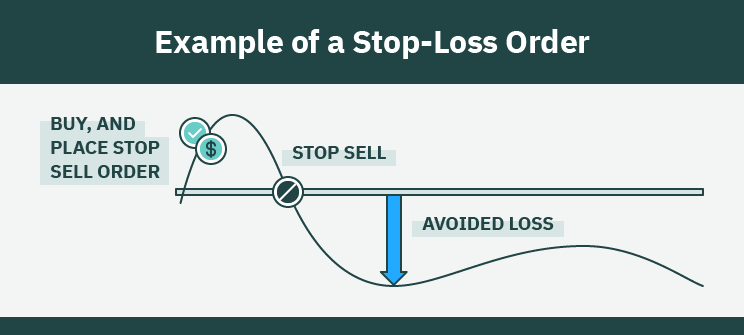
Stop-Loss Orders Can Help Secure Profits
This image explains how stop-loss orders work when it comes to making a profit.
Download

How Do Call and Put Options Work
This image explains the functionality of put and call options.
Download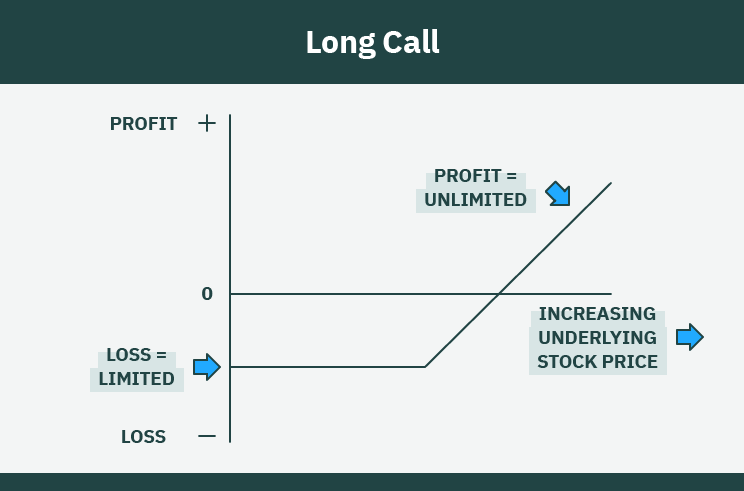
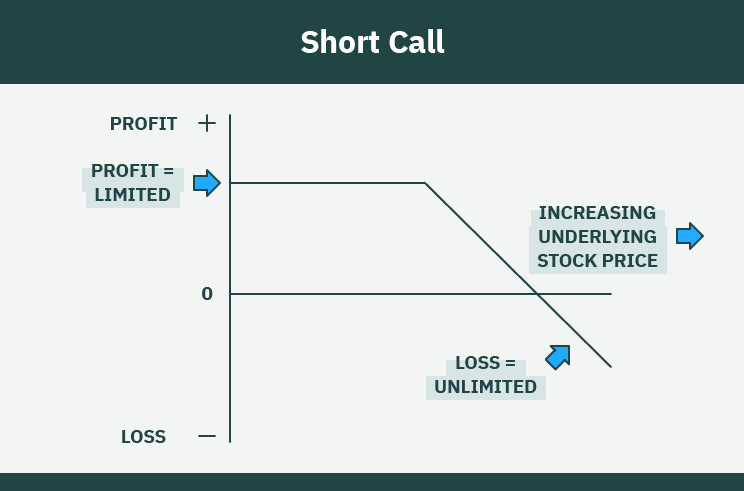
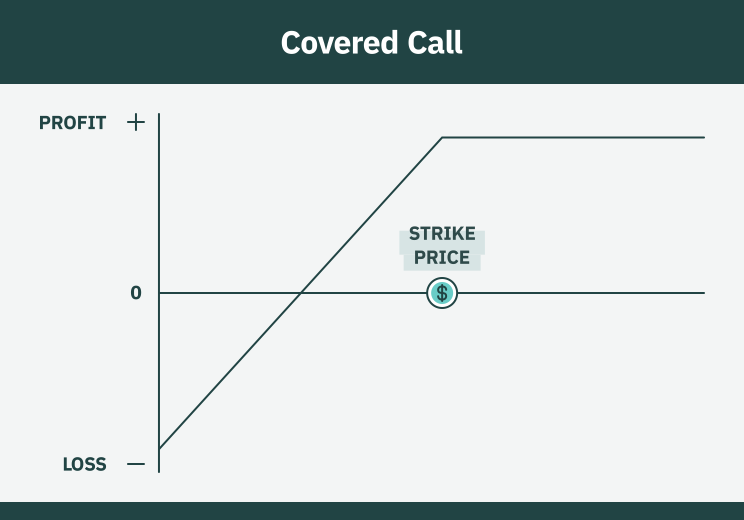
Options Trading Explained: Short Call
This infographic explains how the 'short call' works.
Download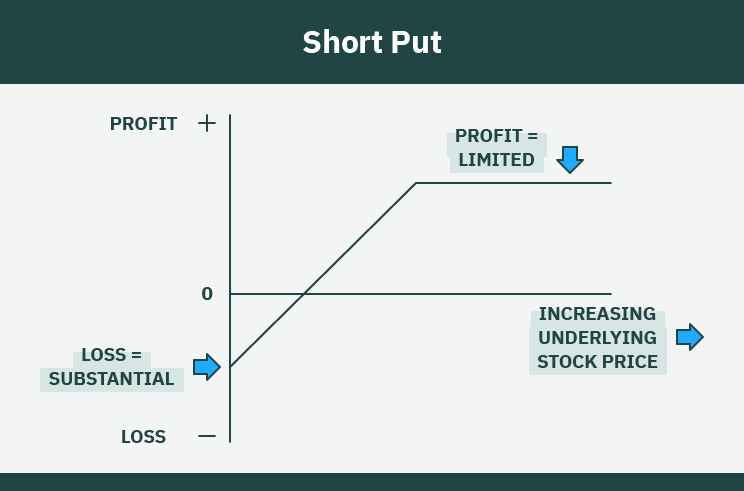
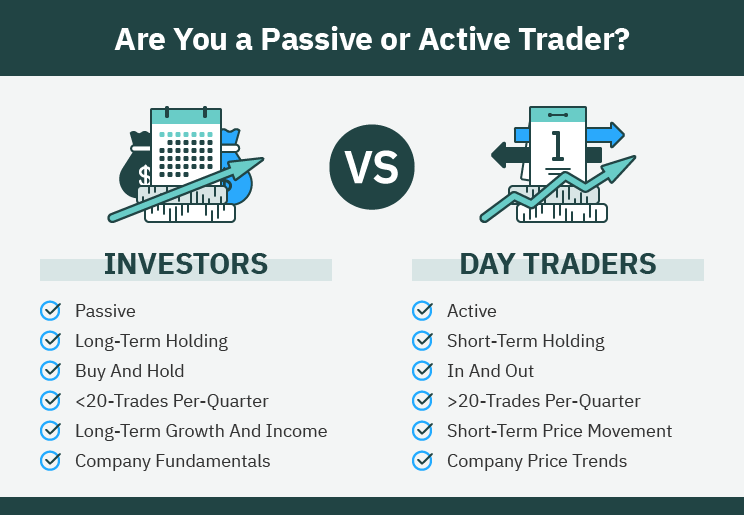
Investors vs. Day Traders
This image shows the difference between investors and day traders.
Download

Difference Between Stocks and Bonds
This image depicts the main differences between bonds and stocks.
Download
Credit Score Scale of Americans
This image shows the credit score scale of Americans with statistics.
Download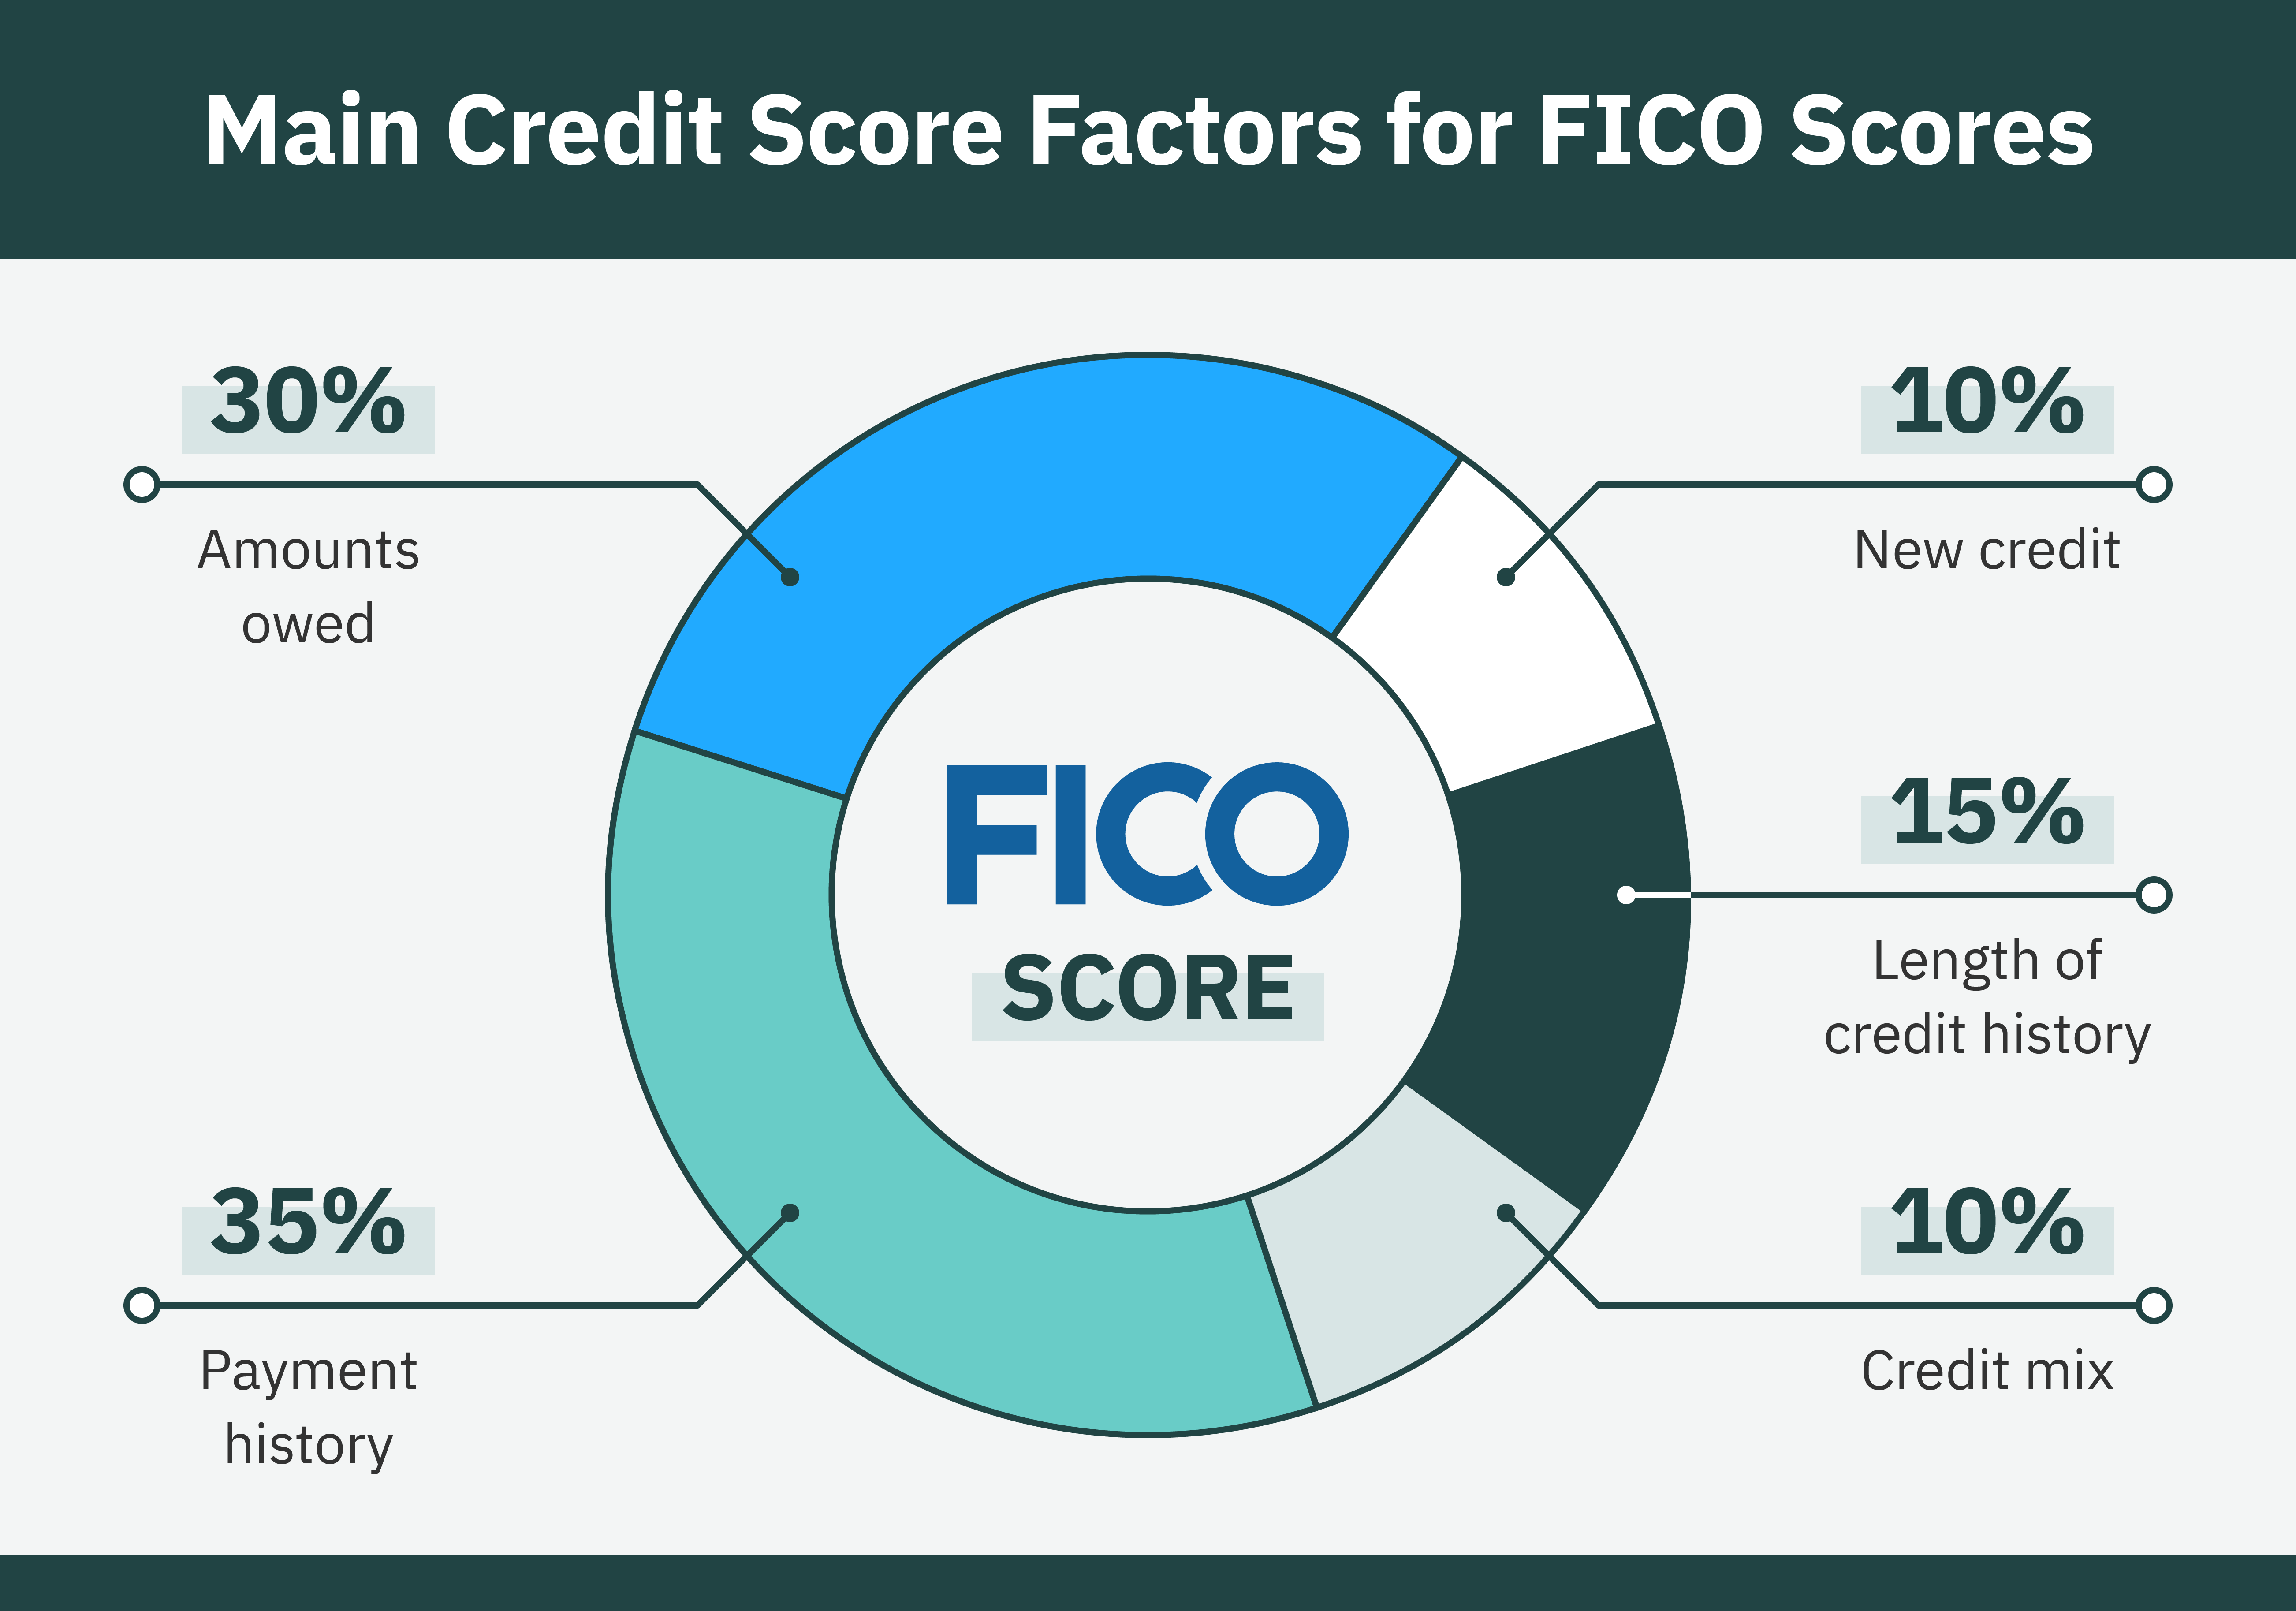
Main Credit Score Factors for FICO Scores
This image shows the main credit score factors for FICO scores with statistics.
Download

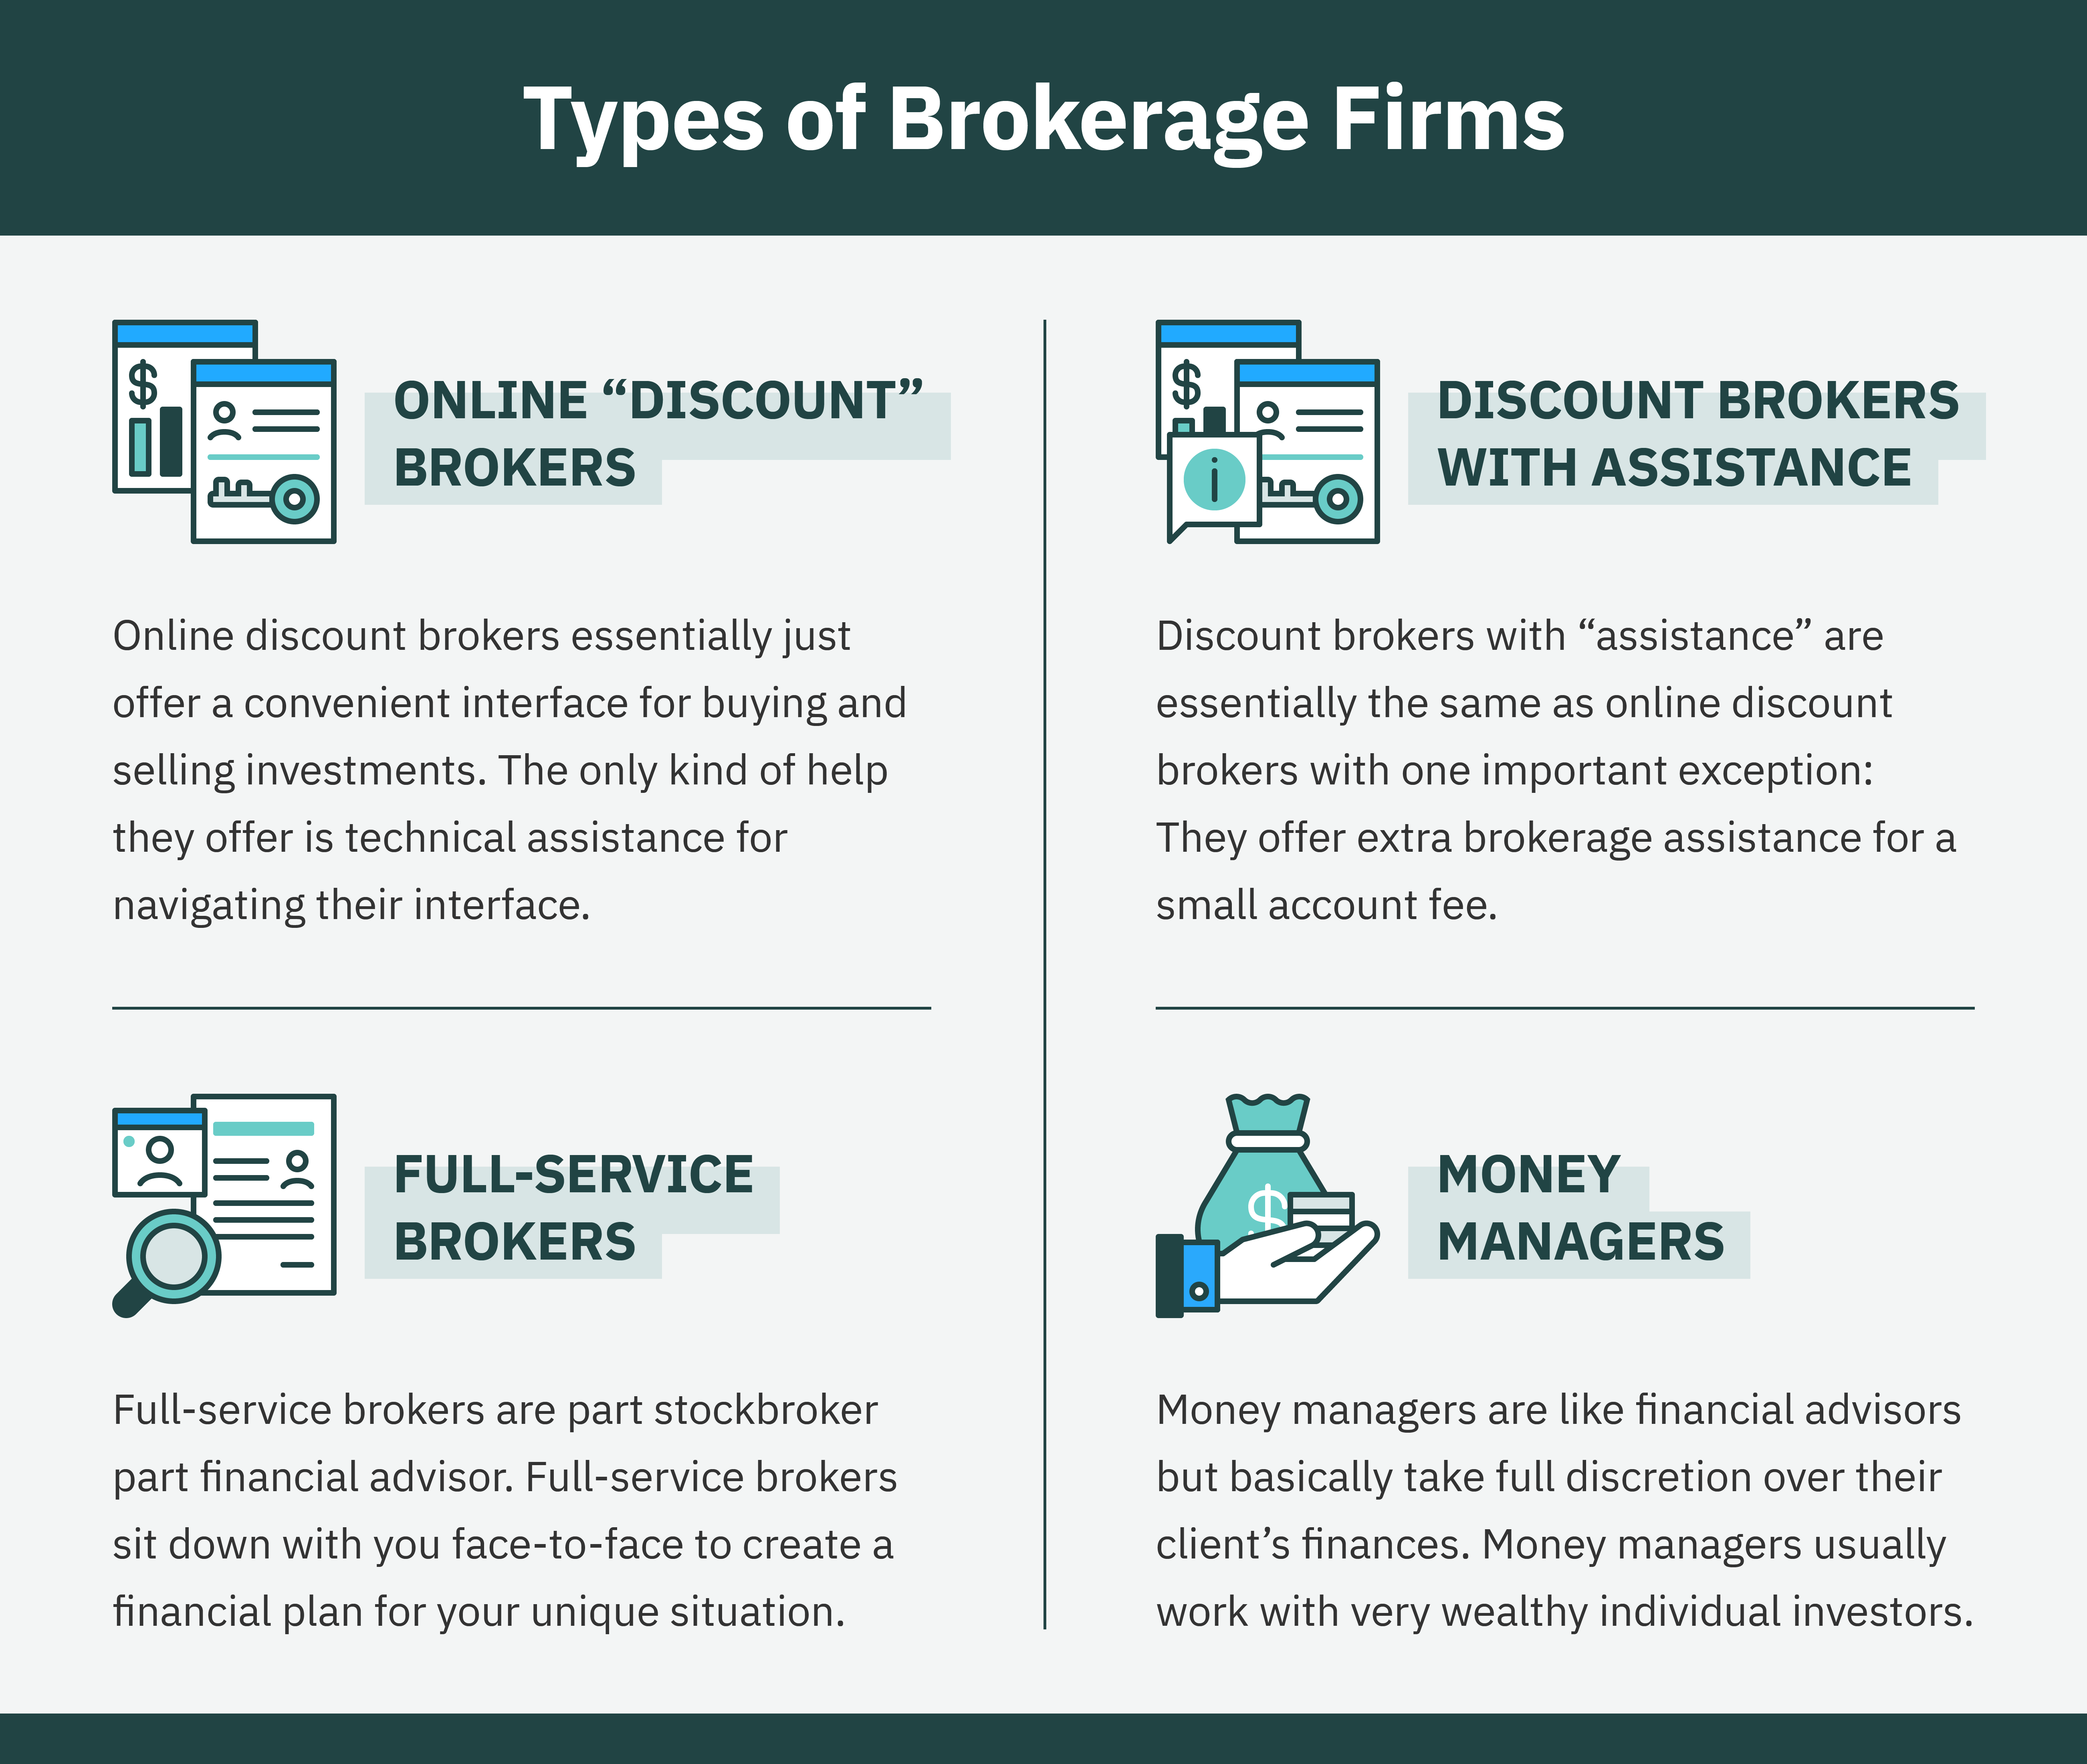
Types of Brokerage Firms
This image shows and explains 4 different types of brokerage firms.
Download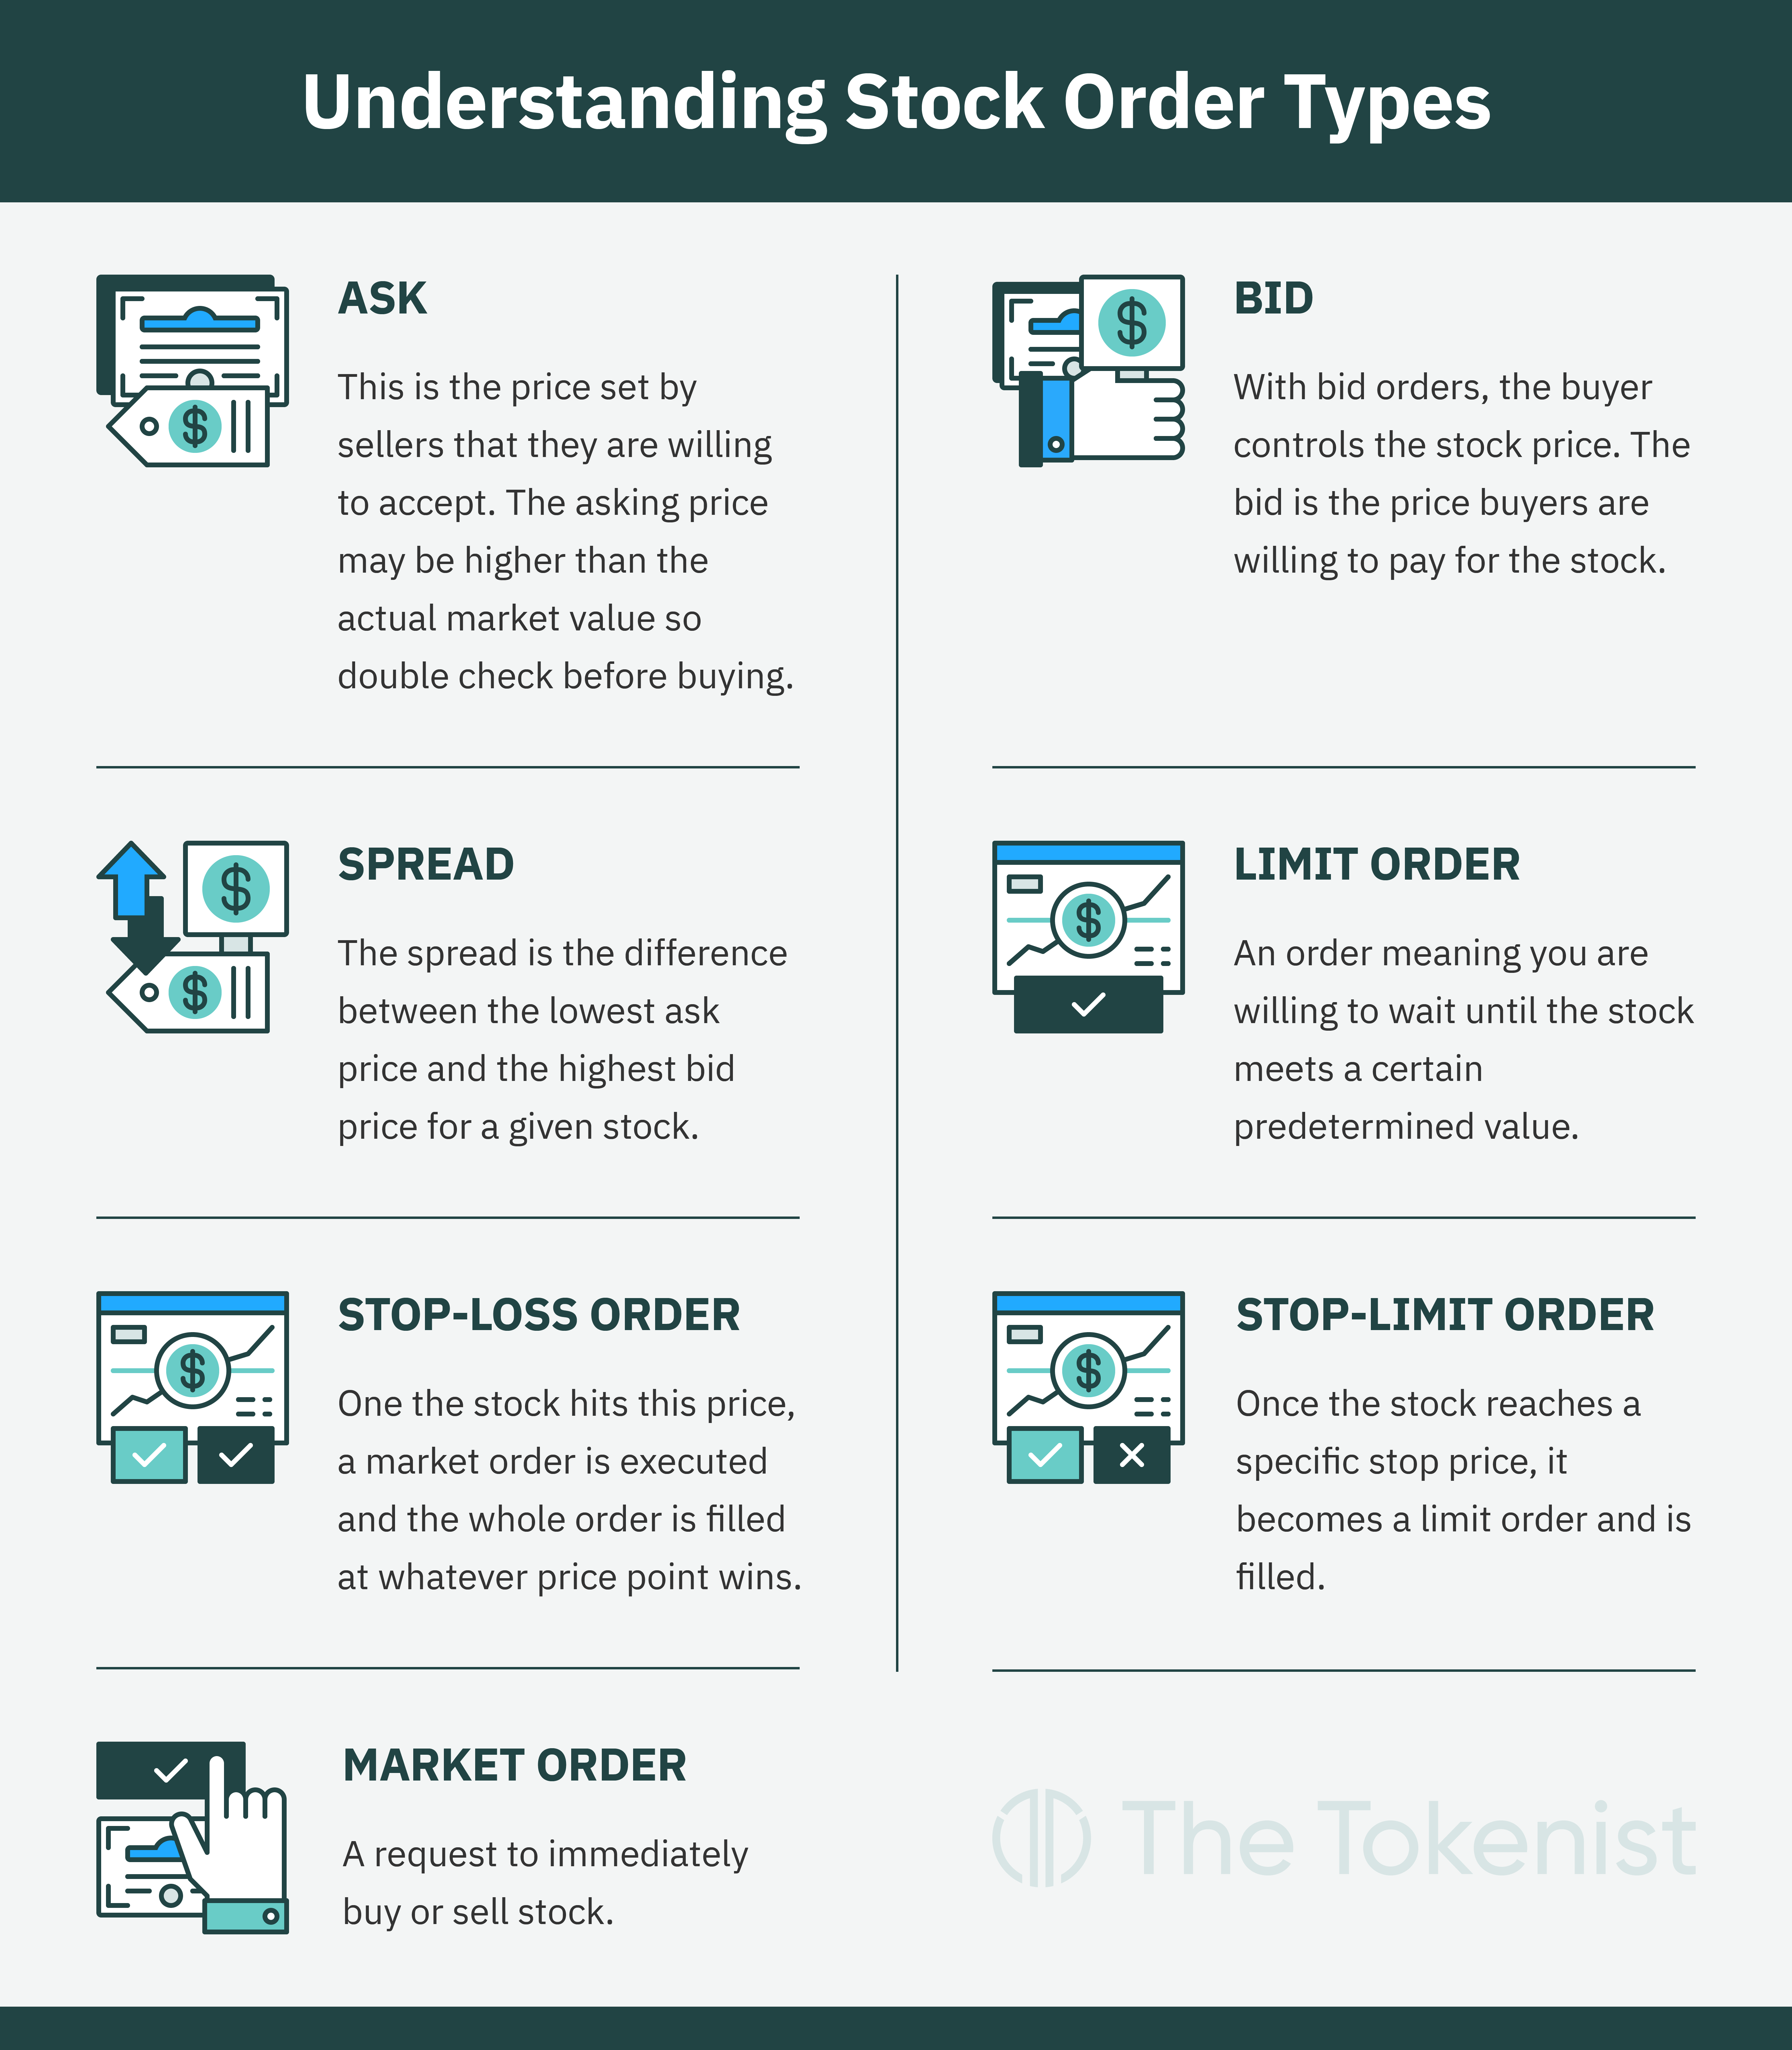
Understanding Stock Order Types
This image depicts and explains the different stock order types.
Download
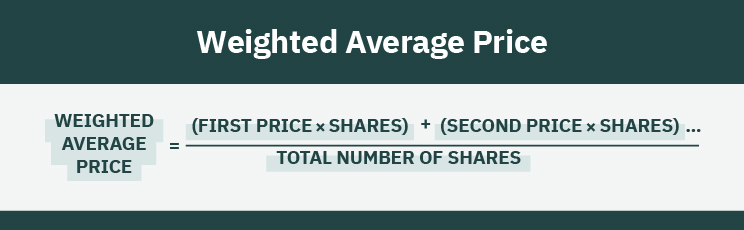
Credit Utilization Rate
This image shows an example of Credit Utilization Rate with a formula.
Download
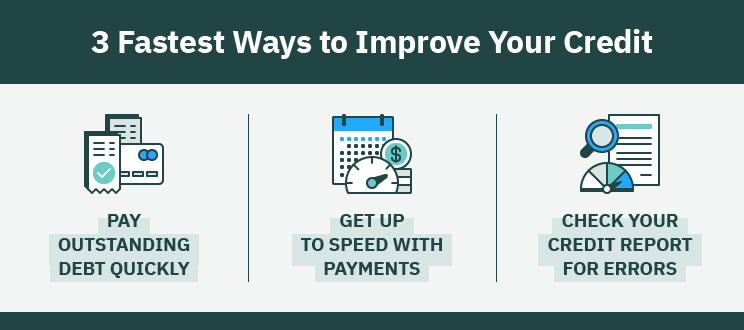
Fastest Ways to Improve Your Credit
This image shows 3 fastest ways to improve your credit.
Download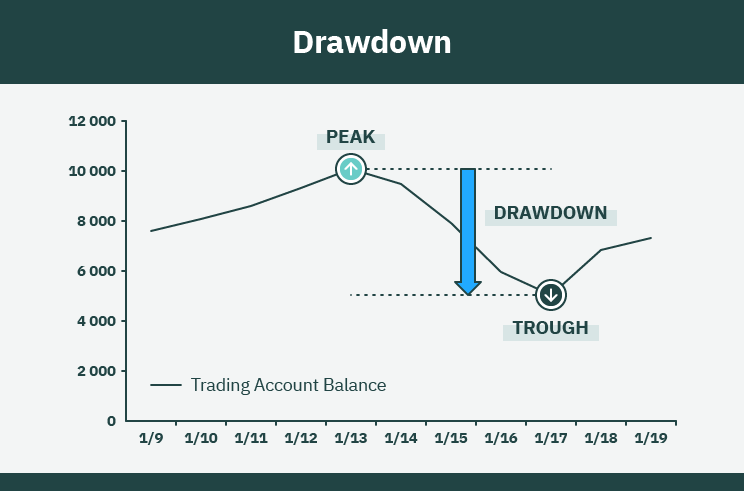

Limit Order vs Stop Order
This image explains the differences between Limit Order and Stop Order.
Download


Finding True Range of One Day
This image explains how to find today’s true price range in 3 steps.
Download


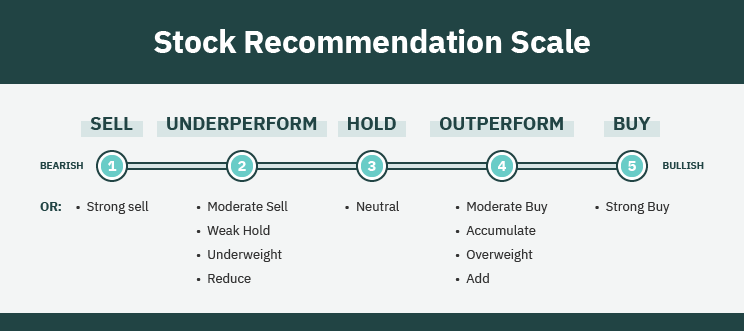
Stock Recommendation Scale
This image shows the analyst rating scale between bullish and bearish markets.
Download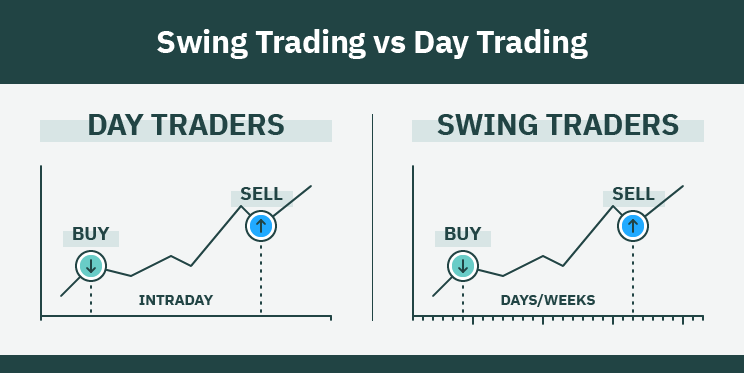
Swing Trading vs Day Trading
This image shows differences between swing trading and day trading strategies.
Download
Gold & Stock's 90-day Correlation with Bitcoin
This image depicts the correlation between gold and stock and Bitcoin in 90 days.
Download
Stock Recommendation Scale
This image shows 5-tier ranking system where stocks will be recommended on a sliding scale of 1 to 5.
Download


Amount of Cryptocurrency Held in DeFi Worldwide
This chart shows the amount of cryptocurrency held in DeFi worldwide from August 2017 to May 2021.
Download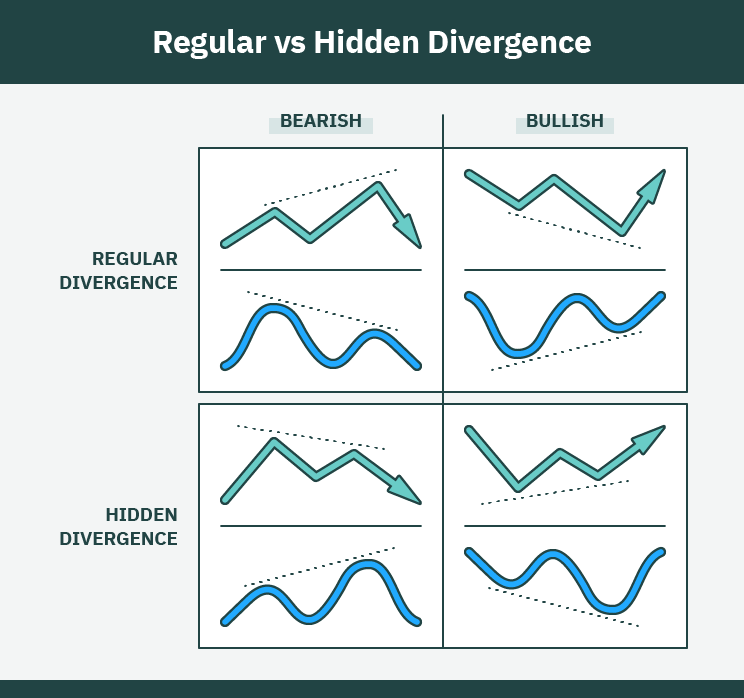
Differences Between Regular and Hidden Divergence
This image shows differences between regular and hidden divergence.
Download

Robo-Advisor, Robo + Traditional and Traditional Advisor
This image shows the main differences between Robo-Advisor, Robo + Traditional, and Traditional Advisor.
Download
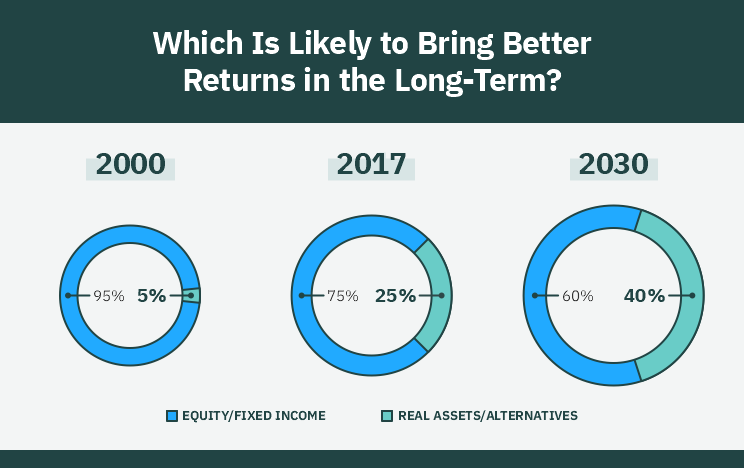
Long-Term Returns
This image shows long-term returns statistic charts comparing equity/fixed income and real assets/alternatives.
Download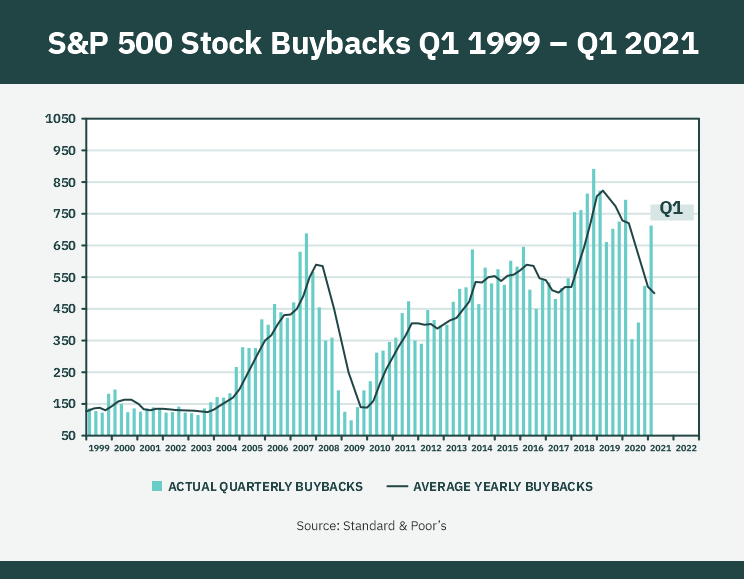
S&P 500 Stock Buybacks Q1 1999- Q2 2021
This chart shows S&P 500 stock buybacks from Q1 1999 to Q2 2021.
Download

The Relationship Between Option Theta and Volatility
This chart illustrates the relationship between option's theta and the volatility.
Download

Amazon's Quarterly Stock-Based Employee Compensation
This image shows Amazon's total stock-based compensation expense through years.
Download
Implied Volatility Factors
This image illustrates the major determining factors for calculating implied volatility.
Download


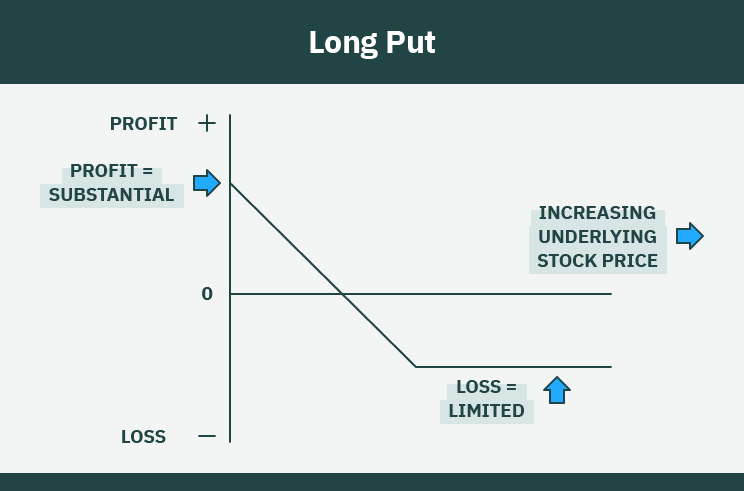
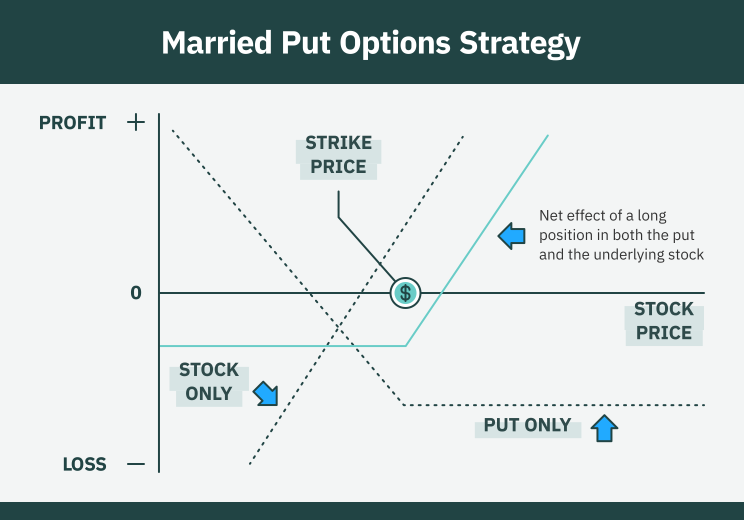
Long Call And Put Options
This image illustrate comparison between long call and put option strategy.
Download

Dividends' Contribution to Total Return
This image shows dividends' contribution to total return varies by decade.
Download


The Cypher Harmonic Pattern
This image shows the Cypher bullish and bearish harmonic chart pattern.
Download

Relationship Between Interest Rates And Bond Prices
This image depicts relationship between interest rates and bond price.
Download


Millennial Debt to Income ratio
This image shows average debt to asset ratio by generation.
Download

In-the-Money vs. Out of the Money
This image explains the differences between "in the money" (ITM) and "out of the money" (OTM) in option trading.
Download
ETF vs. Mutual Funds
This image depicts differences and similarities of ETF and mutual funds.
Download


The Walt Disney Co Shiller PE Ratio Distribution
This image depicts the Walt Disney Co Shiller PE Ratio distribution.
Download


Shiller PE Ratio From 1870 To 2021
This image shows historic Shiller PE Ratio chart from 1870 to 2021.
Download
Mosaic Theory Sources of Information
This image explains mosaic theory sources of information.
Download


Wash-Sale Rule: 31 Days
This image explains how an investment is sold at a loss and then repurchased within 31 days.
Download
Simulations of Small, Medium and Large Cap Stock Prices
This image shows simulations of small, medium and large cap stock prices based on parameters from monthly stock returns from 1926 to 2008.
Download
Full Market Cycle
This image explains the accumulation and ascension stages of full market cycle.
Download
Stock Market Performance by Industry
This image shows stock market performance by industries in 2020.
Download

Growth Stock vs Value Stock Performance
This image compares growth and value stock performance over the years
Download

Movement of Cyclical Stocks Throughout Cycles
This image shows movement of Cyclical Stocks throughout cycles.
Download

Public Debt-to-GDP Ratio
This image shows countries' public debt to its gross domestic product (GDP).
Download
Netflix vs. Blockbuster
This image compares Netflix and Blockbuster revenue $ (billions) through the years.
Download
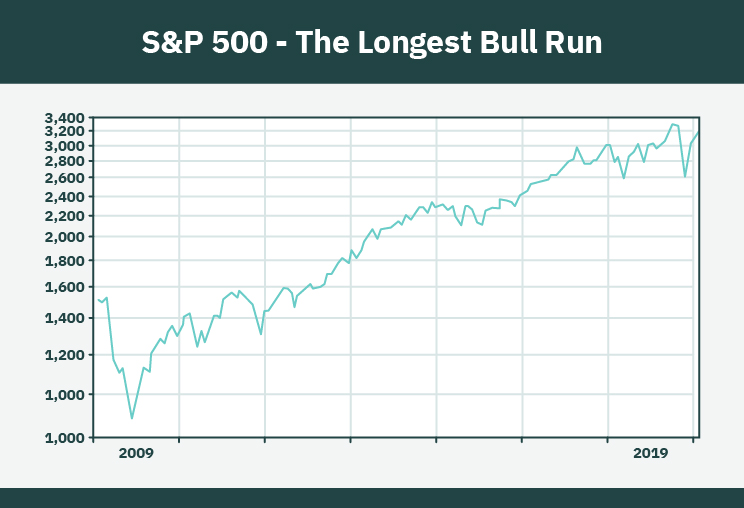
The Market Overall Performance Over the Last 100 Years
This graphic shows market's overall performance over the last 100 years.
Download


Projected U.S. Cannabis Market
This image show projected U.S. cannabis market through years.
Download
S&P Composite Volume Index- Last Price
This image shows index of 500 widely held common stocks that measures the general performance of the market through years.
Download

Share of S&P 500
This image compares the S&P 500 shares for the top 5 and bottom 300 companies through years in percents.
Download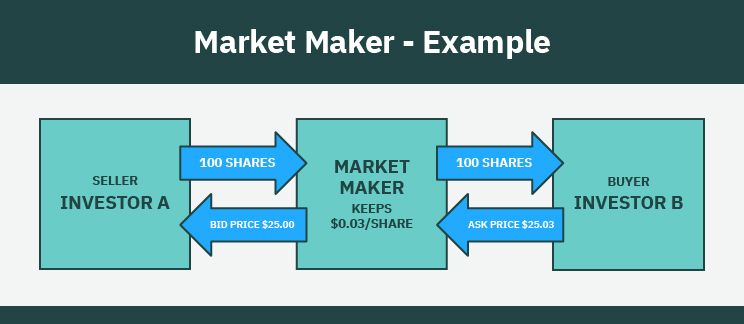

S&P 500 P/E Ratio Five Years Chart
This chart shows the S&P 500 P/E ratio performance for five years.
Download
S&P Composite Volume Index Last Price
This image shows the S&P composite volume index with the last price.
Download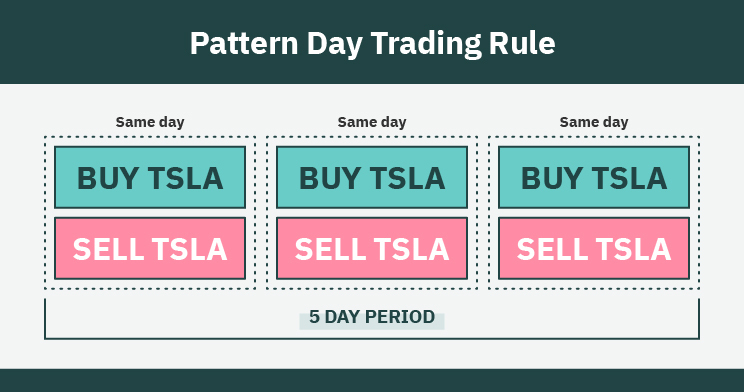
Pattern Day Trading Rule
This image explains the pattern trading rule for five business-day period.
Download


Expected Portfolio Return
This image shows how to calculate the expected return of a portfolio.
Download


AAPL-Average Growth Over the Years
This graphic depicts average growth of Apple ($AAPL) over the years.
Download
MRNA Performance During COVID-19 Pandemic
This graphics shows MRNA performance during COVID-19 pandemic.
Download

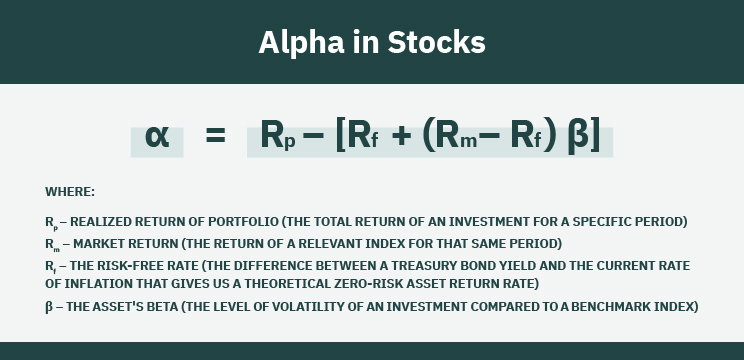
Alpha in Stocks
This image explains how to calculate excess return on an investment after adjusting for market-related volatility.
Download
How CAPM Works
This image explains capital asset pricing model (CAPM) and how to calculate it.
Download


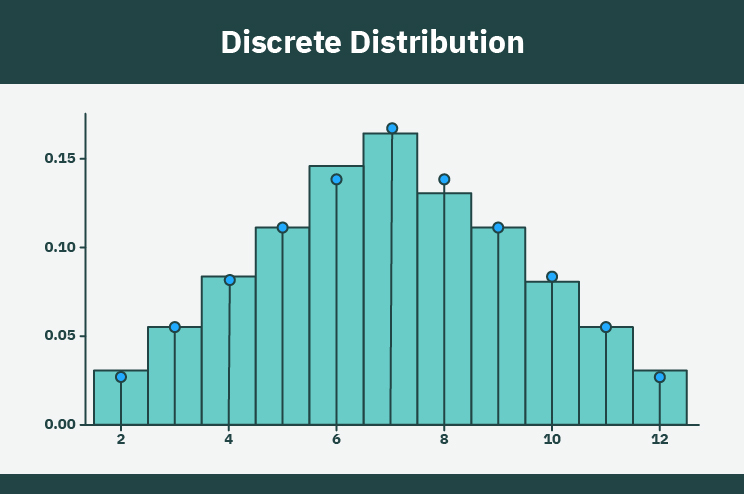
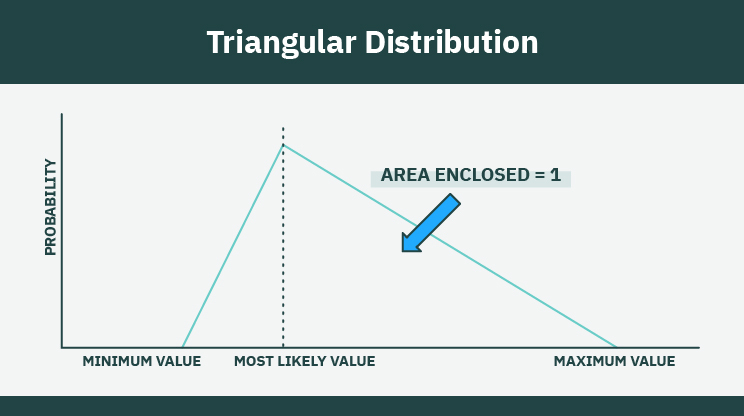
Discrete Distribution
This image shows an example of discrete distribution as statistical concept used in data research.
Download
Periodic Daily Return (PDR)
This graphic shows an example of periodic daily return calculation.
Download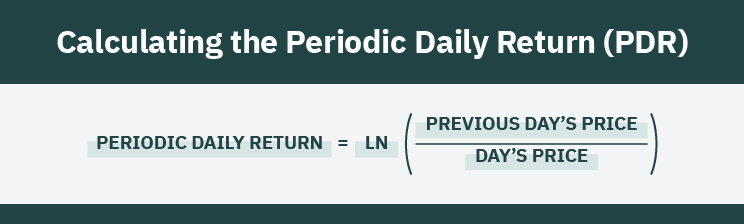
Calculating the Periodic Daily Return (PDR)
This image explains how to calculate the periodic daily return.
Download


Types of Market Maker Trades
This image shows the main differences between agency and principal traders.
Download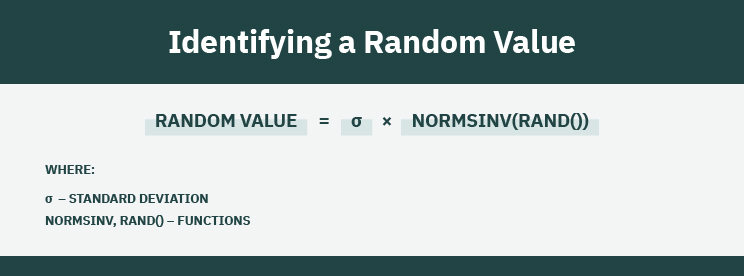
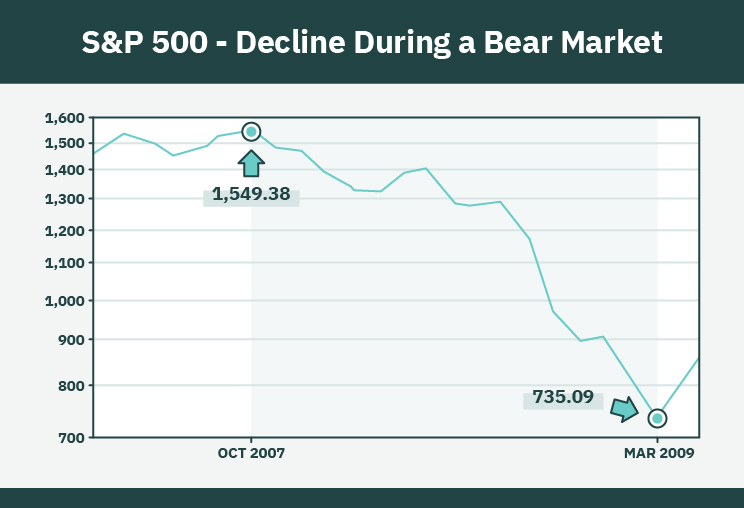
S&P 500 - Decline During a Bear Market
This image explains S&P 500 decline during a bear market.
Download
The Famous “dotcom” Bubble
This image depicts the rise of equity markets value during the dotcom bubble.
Download
Different Stages of a Market Cycle
This image depicts the five different stages of a market cycle.
Download


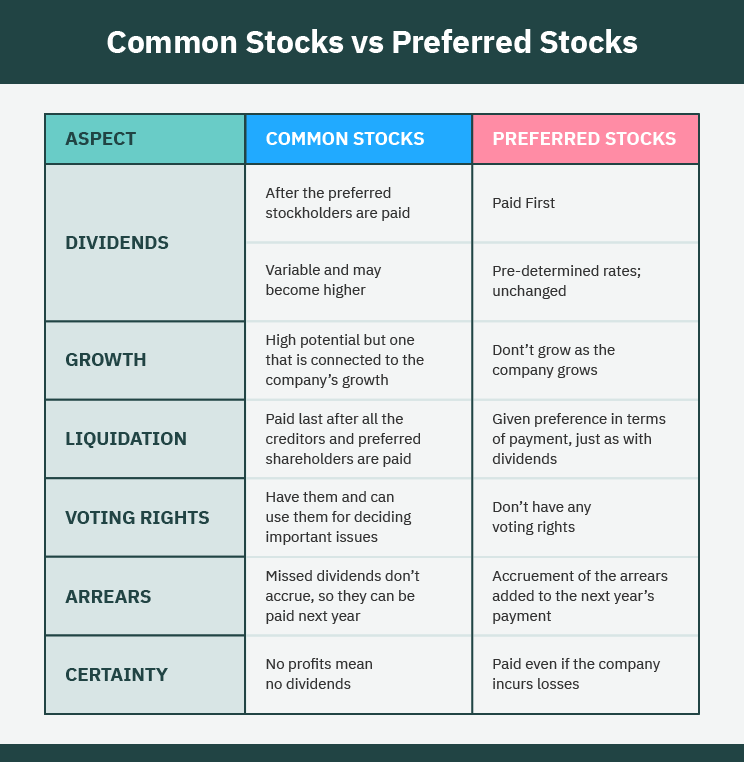
Common Stocks vs Preferred Stocks
This image shows the main differences between common and preferred stock.
Download


The Effect of Inflation on Stocks
This image shows the effect of inflation on stocks through years.
Download
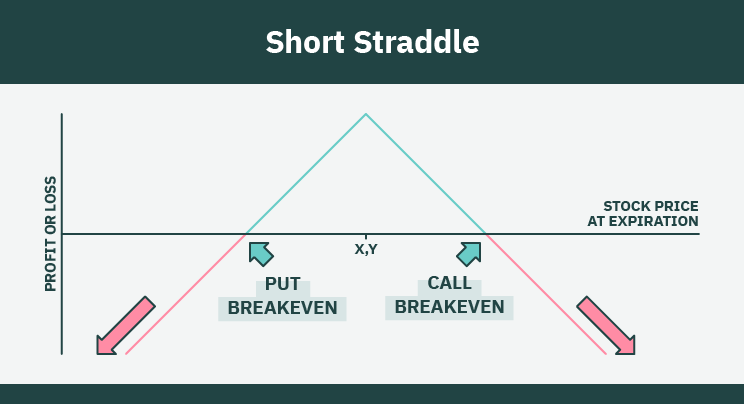
Short Straddle
This image explains a short straddle option strategy of one short call and one short put with the same strike price and expiration date.
Download
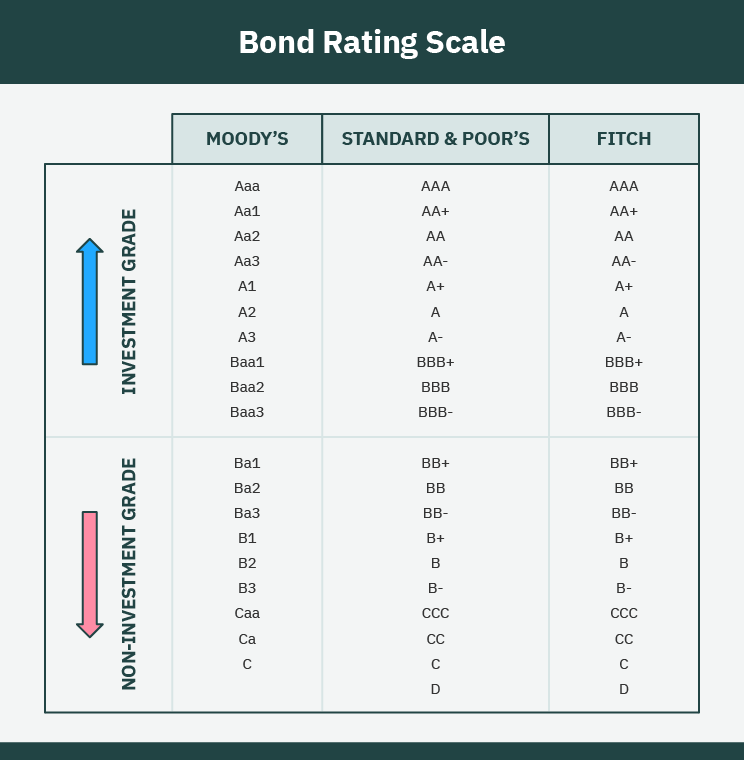
Bond Rating Scale
This image shows the rating scale of the quality and creditworthiness of a bond.
Download

Difference Between Fixed and Variable Spread
This image depicts the main differences between fixed and variable spread.
Download

Yearly Inflation, PCE and CPI Measures
This image shows the yearly inflation through consumer price index (CPI) and personal consumption (PCE) deflator.
Download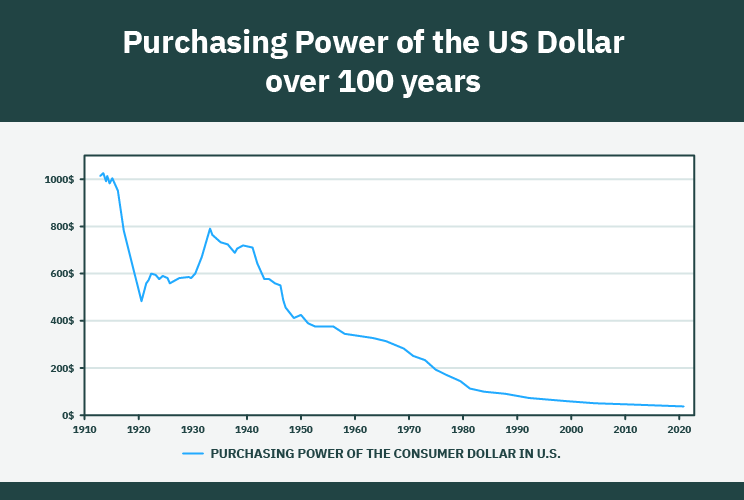
Purchasing Power of the US Dollar over 100 years
This image shows the purchasing power of the US dollar over 100 years.
Download


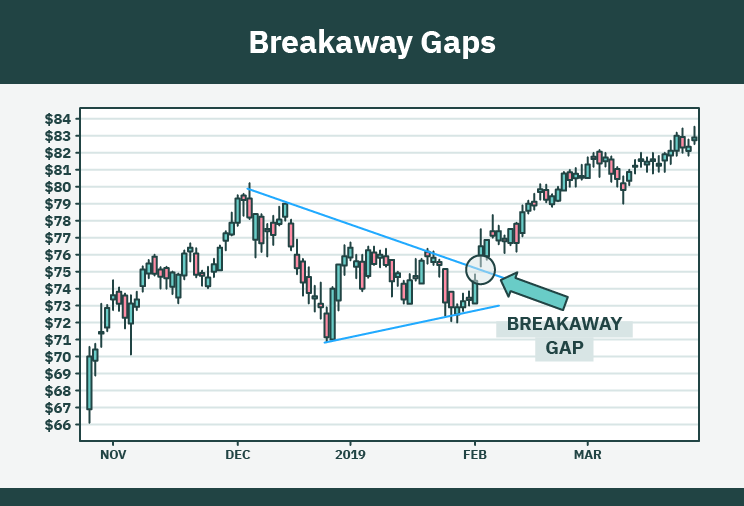
Breakaway Gaps
This image shows an example of strong price movement through support or resistance.
Download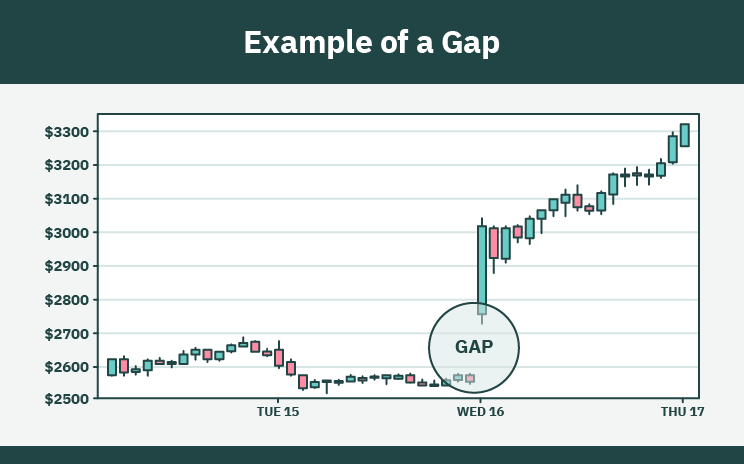
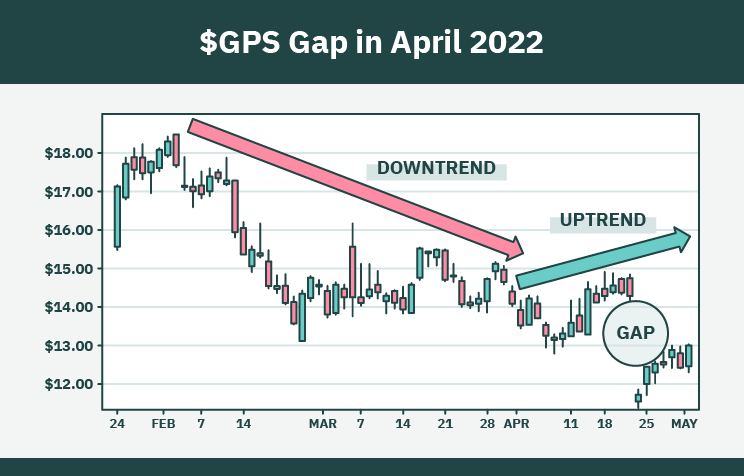
Example of a Gap
This image shows areas on a chart where the price of a stock moves sharply up or down, with little or no trading in between.
Download
Exhaustion Gap
This image describes exhaustion gap as a technical signal that results after a rapid rise in a stock's price.
Download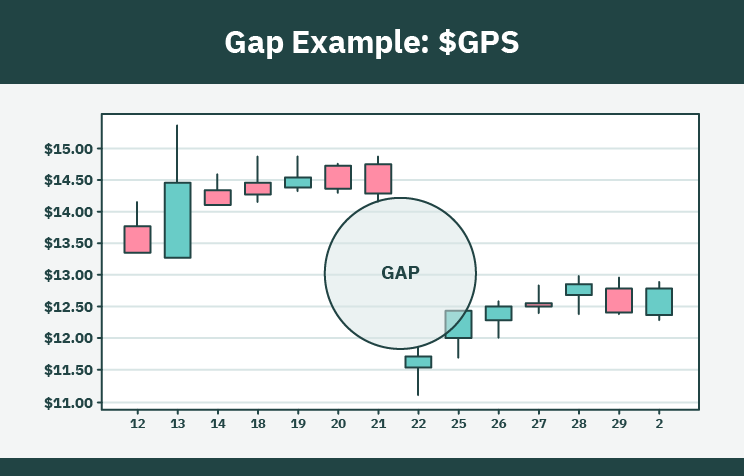
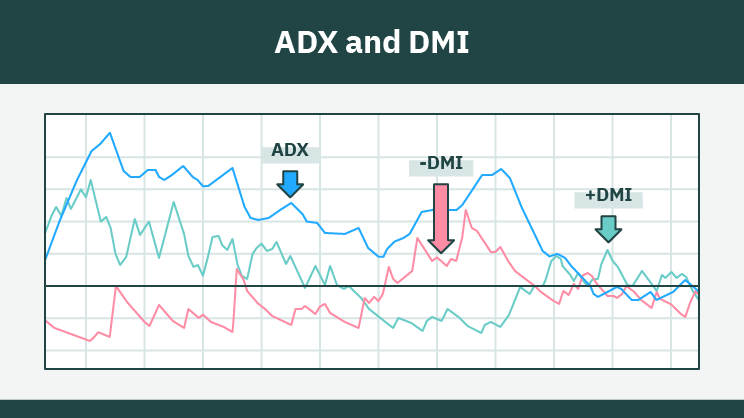
ADX and DMI
This image depicts ADX (Average Direction Index) and DMI (Directional Movement Index) indicators.
Download
Moving Average
This image shows the moving average technical indicator that can be used to determine the direction of a trend.
Download
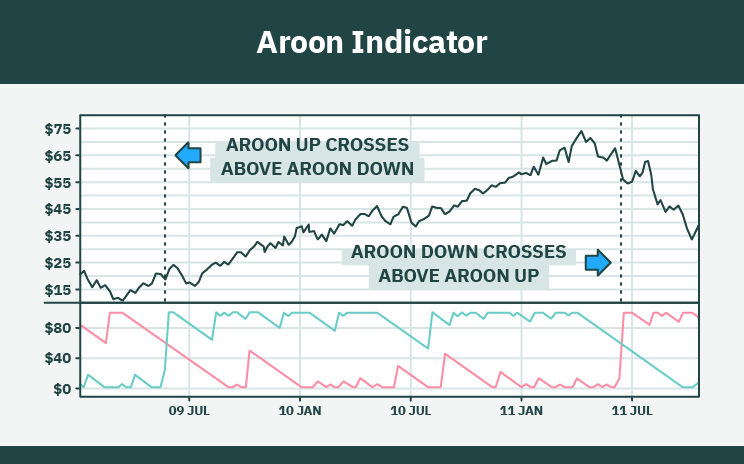
Aroon Indicator
This image explains the trend following price indicator that measures the period between highs and lows lines.
Download

Canada vs. U.S. Sector Breakdown
This image shows statistical data between U.S. and Canadian sectors.
Download
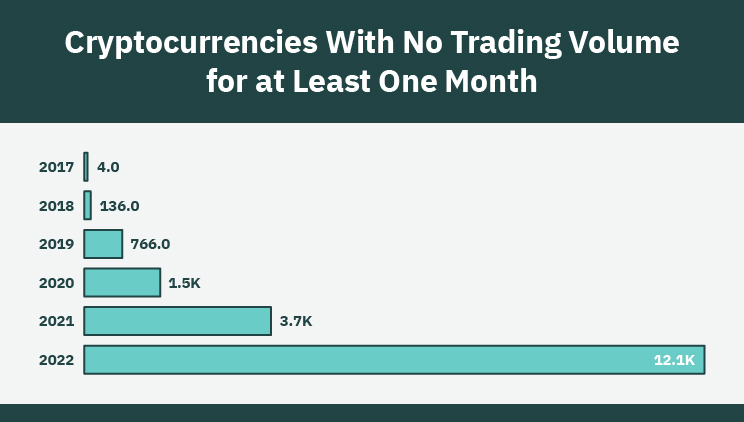
Cryptocurrencies With No Trading Volume for at Least One Month
This image shows cryptocurrencies with no trading volume for at least one month.
Download

