Head and Shoulders Pattern: Spotting Potential Dividend Traps or Opportunities Before a Trend Reversal


All reviews, research, news and assessments of any kind on The Tokenist are compiled using a strict editorial review process by our editorial team. Neither our writers nor our editors receive direct compensation of any kind to publish information on tokenist.com. Our company, Tokenist Media LLC, is community supported and may receive a small commission when you purchase products or services through links on our website. Click here for a full list of our partners and an in-depth explanation on how we get paid.
How can you tell when an uptrend is about to reverse?
The head and shoulders is one of the clearest patterns for spotting potential downturns. Its three-peak structure signals fading bullish momentum and the risk of a shift lower.
For dividend investors, that warning matters. The pattern can highlight when holding onto a stock may expose you to losses, even if payouts look steady. Recognizing it early lets traders and income-focused investors protect gains or adjust positions before the decline.
With its proven track record, the head and shoulders remains a key tool for managing risk and timing exits.
- Definition
- The Psychology Behind It
- Spotting the Patterns
- Variations
- Impact on Dividend Investing
- Strengths
- Risks and False Breakouts
- Complementary Tools
- Conclusion
- FAQs
Defining the Head and Shoulders Formation
The head and shoulders is one of the clearest of the chart patterns that indicate a possible trend reversal. It is made up of three peaks: the left shoulder, the head, and the right shoulder. The left shoulder is formed following an upward move when the price reaches a high and pulls back. The head is next as the price rises above the first peak to create the highest point before falling again. Finally, the right shoulder, when the price makes another attempt to rally, only finds a lower high, indicating the loss of momentum.

Beneath these peaks is the “neckline” which is drawn through the lows of the pullbacks. This line is the most important confirmation line. When the price goes below it after the right shoulder, traders see it as a strong indication that the uptrend is over and a reversal may be taking place. The pattern corresponds to a shift in psychology: buyers have less conviction and sellers more control.
The importance of the formation is due to its consistency. By often marking the exhaustion of bullish energy, it is helpful to both traders and dividend investors to prepare for the downside risk. Spotting it in real time offers the opportunity to save gains or shift positions before momentum completely changes direction, making it a great tool in managing reversals.
The Psychology Driving the Pattern
The psychology of the head and shoulders is that there is a transition from bullish strength to bearish control. At the beginning, buyers are in the driver’s seat, pushing prices higher and creating the left shoulder. This rally signals confidence, often fueled by strong earnings, upbeat sentiment, or demand for dividend-paying stocks—similar to when the Dow recently jumped 600 points on hopes that inflation data wouldn’t derail a Fed rate cut. The subsequent pullback indicates profit-taking, but the optimism is not gone.
Momentum then takes off again and the head is formed. This higher peak indicates that the buyers still have power, but also it is the final great rush of enthusiasm. The decline that ensues is an indication that demand is giving way as sellers become more aggressive and buyers lack conviction.
When the right shoulder is formed, psychology makes another shift. The market tries to rally again but fails to reach the height of the head, fading confidence and softening demand is evident. External forces can intensify that hesitation, as seen with discussions around new tariffs reshaping market psychology. Fewer investors are willing to buy at higher levels even in dividend stocks that typically have steady interest.
The breaking point is the neckline. A drop below it confirms for many that bullish energy has turned to bearish sentiment, similar to how oil markets can shift when bearish pressures begin weighing on prices. For dividend investors, this highlights the fact that even income-producing stocks can fall out of favor when market psychology takes a turn.
Spotting the Left Shoulder, Head, and Right Shoulder
Identifying a head and shoulders pattern requires following the series of peaks and troughs that comprise the pattern. The left shoulder forms first; this is usually a moderate rally that peaks before falling back to support. This first high is not extreme but sets the stage for the stronger move upwards that ensues. Traders keep a close eye on it as it can be the first indication of exhaustion in an uptrend.
The head is next and is the most prominent feature. Prices move higher than the left shoulder to make the highest peak before retreating, often to the same level as the pull-back of the left shoulder. This alignment forms the neckline, which is a horizontal or slightly sloping level dividing continuation and reversal.
Finally the right shoulder is formed as the market makes another rally attempt, but fails to match the head’s height. This lower peak shows fading momentum and when prices return to the neckline, traders look for confirmation. A strong break below the neckline is the critical signal that sellers have taken over, much like when a stock such as UnitedHealth rallies and chart analysis points to what may follow next. For both traders and dividend investors, this break is an important indicator to take note of in order to make adjustments—whether that be holding on to capital or positioning for downside opportunities.
Variations of the Head and Shoulders Pattern
While the classic head and shoulders is a bearish reversal signal, its common variation—the inverse head and shoulders—suggests a bullish reversal. Instead of appearing at the top of an uptrend, it emerges after a decline. Here, the shoulders are minor lows and the head is a deeper trough in the middle. When prices break above the neckline after the right shoulder is formed, it indicates that buying momentum has returned and the downtrend may be over. In fact, a recent pattern in Amazon’s stock (AMZN) around mid-April 2025 looks a lot like an inverse head and shoulders setup, with lows forming, a deeper trough, and buyers stepping in ahead of its first Kuiper satellite launch on April 9.

Both versions are important to the dividend investor by providing for improved timing. A standard head and shoulders can provide a warning to reduce exposure or take profits before a decline eats away at capital, even if payouts do not decline. An inverse formation can point to an attractive entry point, presenting the opportunity to capture both a price appreciation and future dividends.
These variations also highlight the need for context. Traders and dividend growth-oriented investors need to determine if the chart is showing exhaustion at a peak or strength at a bottom. While there is no pattern that guarantees results, having the head and shoulders in both forms helps to get dividend strategies in tune with market momentum. For short-term traders, such signals can often open up opportunities for timing buys and sells around dividend events or price-sensitive moves.
How the Pattern Impacts Dividend Investing
The head and shoulders has very obvious implications for dividend investors as it can serve as a warning as well as an opportunity signal. If the pattern is at the top of a trend, it is a signal to the investor that a dividend-paying stock may be losing momentum and may go down. Spotting this early allows income investors to have the opportunity to de-risk exposure before things get even weaker. This is important because falling share prices can make yields appear more attractive but that higher yield can mask underlying risk.
To the opposition, the inverse head and shoulders forming following a decline can indicate reinvestment potential. Dividend investors who got out earlier, or are thinking about a new position, may look at a breakout above the neckline as reinforcement that the stock is getting stronger. This way they are able to buy at favourable levels, combining potential gains with steady income and supporting strategies built around dividend timing trades.
In this way, the pattern is more than a trading tool—it improves the dividend strategy. Understanding common formations can help investors avoid holding through long downturns, and inverse setups can indicate good entry points for investors. For dividend-focused traders, combining these technical signals with payout analysis provides a more robust framework for decision-making to enhance both risk management and return potential.
Strengths of the Head and Shoulders Setup
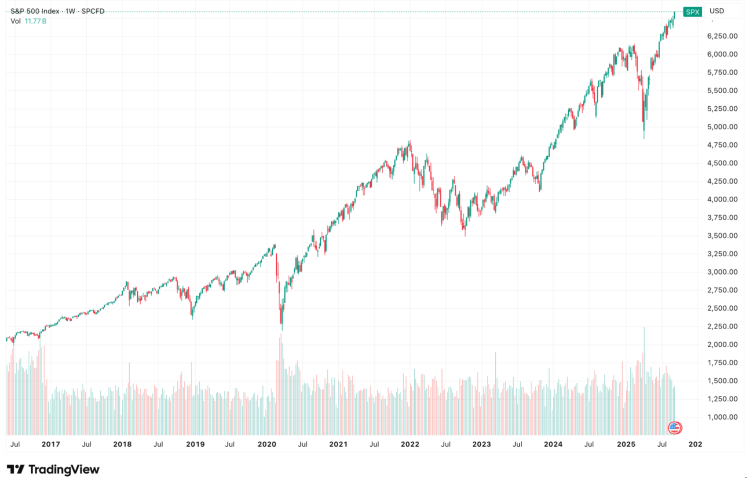
Traders appreciate the head and shoulders setup for being a setup that has a long history of working. Across markets and timeframes, it has been consistently signaling reversals, making it one of the most trusted tools in technical analysis. Its simple visual structure, consisting of a left shoulder, head and right shoulder with a neckline on top, provides a straightforward way to spot weakening trends without relying on complex indicators. This clarity is particularly valuable in fast-moving markets, as seen when the S&P 500 recently hit a new high in September 2025 and traders needed to react quickly to shifting momentum.
One of the other strengths is that it can give measurable targets. Once the neckline breaks, traders can predict potential moves based on the distance between the head and neckline and project that distance downward, upward in the inverse case. This provides a tangible foundation for determining goals and stop loss levels, which can lead to better risk management and reward planning.
For dividend investors the benefits are not just trade timing. A head and shoulders top can serve as an early warning to scale back exposure before capital erosion takes place. An inverse variation on the other hand accentuates the favorable levels of entry where both dividend yield and capital gains could coincide. As often highlighted in expert investing bulletins, combining historical reliability, structural clarity and defined outcomes, the head and shoulders continues to be a useful pattern for managing risk while seeking steady returns.
Risks and False Breakouts to Watch For
Although the head and shoulders is one of the most known reversal setups, it has risks associated with it. A very common problem is incomplete formations: a chart might have a left shoulder and a head, but it does not have a proper right shoulder or neckline break. In such cases acting too soon in these situations often results in premature trades which never provide the reversal expected.
False breakouts are another trap. Even when the breach of the neckline occurs, the prices can briefly go below or above the level before snapping back in the previous trend. These “fake-outs” can cause stop-losses, and shake traders out before the real move. Relying only on the appearance of the pattern can therefore be misleading.
To help manage these risks, traders should validate breakouts with supporting evidence such as volume spikes, momentum indicators, or moving averages. For example, a neckline break on above-average volume is more reliable than one on weak activity. Aligning the setup with broader sentiment or fundamentals—such as dividend stability or earnings strength—adds more weight to the signal, much like Procter & Gamble’s recent earnings beat that reflected resilient demand for household staples.
By considering the head and shoulders as part of a larger analysis, traders and dividend investors can minimize the risk of being misled by false signals and make more informed decisions.
Using Complementary Tools with the Pattern
The head and shoulders becomes more reliable when used in conjunction with some tools that confirm price action. Moving averages are particularly useful. A break in the neckline which also takes the price below a long-term average gives the trader more confidence that momentum has changed. Shorter-term averages can be used to demonstrate if the right shoulder is forming under weakening strength, adding reinforcement to the reversal case.
Momentum indicators such as the Relative Strength Index (RSI) also provide some confirmation. In the case of a head formation, if the head is formed with an overbought RSI and the right shoulder shows declining momentum, it is a sign of fading buying pressure. Divergences, where the head is making new highs and RSI is not, are further indicative of weakening demand.

For dividend investors, layering in payout analysis adds another layer of insight. A head and shoulders reversal coming on top of slowing or unsustainable dividends is a strong argument to put less weight on. If there is still high stability of the dividend, in spite of the technical signal, investors may opt for a more cautious approach, a point often emphasized in popular investing publications.
By using a combination of chart analysis, moving averages, momentum indicators, and dividend fundamentals, traders don’t just rely on the pattern to make a call. This integrated approach results in a higher degree of accuracy, better entry and exit timing, and reduced risk of false signals while also supporting long-term perspectives such as assessing intrinsic value from dividends.
Conclusion
The head and shoulders is one of the best known of all the reversal patterns and offers traders and dividend investors a systematic way to help them anticipate changes in price direction in the market. Its simple form and long track record make it a practical tool for managing risk and determining the timing of entries or exits. Understanding both the standard and inverse versions prepare investors for opportunities in declining and recovering markets.
For dividend investors, the pattern shows when to exercise caution, and when to reinvest. Combined with other tools such as moving averages, RSI, and measures like the dividend payout ratio, its signals become even stronger.
While this is not a guarantee, the head and shoulders is a good guide. Confirming it through technical and fundamental checks helps reduce false signals and helps to make smarter decisions. Added into a broader strategy, it provides a balanced approach to navigating volatility in the pursuit of both growth and income.
Head and Shoulders Pattern: FAQs
-
What Does the Head and Shoulders Pattern Indicate in Trading?
The head and shoulders pattern is very well known as a reversal signal. A regular head and shoulders usually means that an uptrend is losing steam and a bearish reversal can be imminent, and the inverse version means the end of a downtrend and the beginning of bullish momentum. For income-focused traders, these shifts can also influence measures like the equity yield rate, since price movement affects the perceived value of payouts.
-
How Can Dividend Investors Use the Head and Shoulders Pattern?
Dividend investors can use this pattern to look for potential declines and preserve their positions. By recognizing the setup early they are able to avoid holding through price drops that may destroy the value of dividend-paying stocks, or make plans to reinvest when prices have stabilized at lower levels. This approach can also support strategies built around profit sharing stocks, where stability of both price and income streams matters.
-
What Is the Difference Between a Regular and Inverse Head and Shoulders?
The regular head and shoulders forms after an uptrend and is a sign of a possible bearish reversal. In contrast, the inverse head and shoulders forms after a downtrend and points to a bullish inversion. Both have the same structure but they happen in opposite market situations.
-
How Reliable Is the Head and Shoulders Formation?
The head and shoulders pattern is viewed as one of the most reliable of all chart formations, but like all technical tools, it isn’t foolproof. False breakouts happen, particularly if the neckline breaks without strong volume, similar to how a major chip sector ETF can remain stuck in a range until a catalyst like Nvidia earnings provides the push. Traders will often use additional indicators to help improve accuracy.
-
What Indicators Help Confirm a Head and Shoulders Breakout?
Volume analysis is one of the most important confirmations, since a breakout in higher than average volume is a strong signal. Moving averages, the Relative Strength Index (RSI) and trendlines can also be used to provide supporting evidence to validate the pattern before acting on it.
All reviews, research, news and assessments of any kind on The Tokenist are compiled using a strict editorial review process by our editorial team. Neither our writers nor our editors receive direct compensation of any kind to publish information on tokenist.com. Our company, Tokenist Media LLC, is community supported and may receive a small commission when you purchase products or services through links on our website. Click here for a full list of our partners and an in-depth explanation on how we get paid.


