Trend Trading Explained
A stock’s price isn’t set in stone. But, trend trading can help you identify which direction it may go.


All reviews, research, news and assessments of any kind on The Tokenist are compiled using a strict editorial review process by our editorial team. Neither our writers nor our editors receive direct compensation of any kind to publish information on tokenist.com. Our company, Tokenist Media LLC, is community supported and may receive a small commission when you purchase products or services through links on our website. Click here for a full list of our partners and an in-depth explanation on how we get paid.
Do you ever wish you could tell what a stock’s price is going to do in the near future?
We empathize – but unfortunately, we cannot recommend the use of any particular crystal ball. What we can do, however, is explain how a little technical analysis and knowledge of stock charts can be used to predict trends in asset price.
Trends represent the general direction that the price of an asset or an entire market is taking. If an uptrend is present, the price is gaining ground and becoming higher – when a downtrend is occurring, the opposite is happening.
If an investor can correctly identify a trend, taking advantage of it is pretty easy. But this isn’t a simple matter – trends are dynamic, subject to an enormous variety of factors, and notoriously fickle. But with a little research, investors can learn how to spot the tell-tale signs of trends appearing, reversing, and intensifying – and in all of these cases, a profit can be made.
While trend trading is usable in both the short-term and the long-term, and doesn’t require just as much technical knowledge and constant attention as some other strategies, it still requires more effort than simple buy-and-hold investing.
However, investors with slightly higher risk tolerances or those looking to branch out into short-term trading will be hard-pressed to find a more versatile and beginner-friendly short-term strategy.
Momentum trading, which includes trend trading, has proven to be an effective method both in surging markets and times of crisis. Trend funds, in particular, have seen stellar returns since early 2022. Trend trading obviously isn’t just a passing trend – so let’s see what all the fuss is about.
- The Definition of Trend Trading
- Understand How Trend Trading Works
- Different Strategies for Trend Trading
- An Example of Trend Trading
- Trade Trending Reversals
- Trend Trading vs. Swing Trading
- Pros and Cons
- How to Trend Trade Cryptocurrencies
- Conclusion
- FAQs
The Definition of Trend Trading 📚
To start everything off, first, we have to deal with what exactly trend trading is. But before that, we have to define a few crucial terms before moving on.
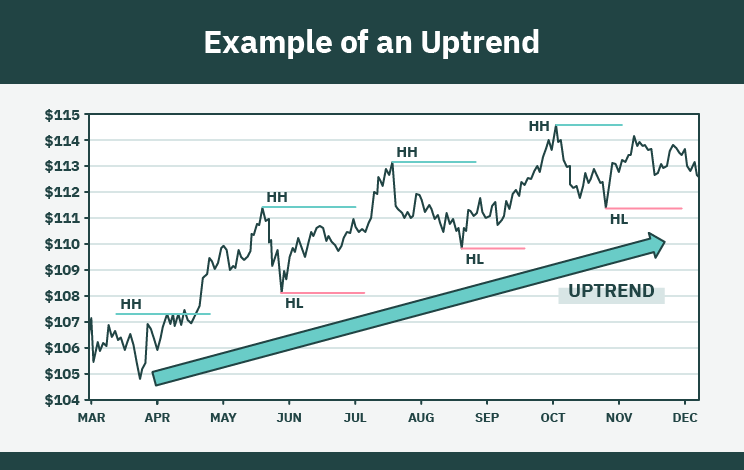
A trend represents the broad direction of an asset’s price movements over time – in other words, whether or not an asset’s price is generally going up or down. There are two types of trends – uptrends and downtrends.
Uptrends are characterized by higher swing high prices and higher swing low prices, while the situation with downtrends is the exact opposite – they are recognized by lower swing highs and lower swing lows.
Trends are a very wide category – while some last for a short time, long-term trends do occur – some of which can even last for years. The theory is this – if an investor can accurately tell when a trend is going to occur or reverse itself, then they can purchase, sell, or short stocks at the right time – giving them a lot of trading opportunities.
Trend trading is an approach based on technical analysis that can be adopted for short-term, medium-term, and long-term investing. It is considered a form of active investing, and requires knowledge of several technical indicators, charting patterns, and one of the top apps for buying and selling stocks with an advanced trading platform.
However, although it is a demanding approach, it can also be incredibly rewarding – understanding when to join a trend and when to jump ship allows investors to utilize momentum to capture profits no matter what the asset in question’s price action looks like.
Even for those not interested in trend trading, this topic is still important – trends, knowing how to identify them, and the strategies that we will be covering today are crucial for a whole host of short-term trading strategies.
Understand How Trend Trading Works 👷♂️
Trend trading operates on a simple assumption – when a security enters a trend, it will experience a significant period of beneficial price action. Identifying a trend before it occurs, or just as it is starting, allows trend investors to get in early on the action and net themselves some nice returns.
Uptrends make for great opportunities for long positions, while downtrends are ripe with opportunities for short-selling. However, before we move on to concrete strategies, there are a couple of basic terms that have to be hammered out – so let’s take care of that first.
How to Identify a Trend 🔍
Identifying a trend is something that falls under the umbrella term of technical analysis. To cut a long story short, technical analysis seeks to analyze the past performance of an asset in order to predict future price action.
Technical analysis relies on a couple of key metrics and charting tools (which we will cover in more detail below), but the gist of the process is as follows – uptrends show a clear pattern in that the asset’s price experiences higher highs and higher lows, and downtrends show a clear pattern that the asset price experiences lower highs and lower lows.
That’s just a simple explanation to keep in mind – however, to truly identify a trend (without making any costly mistakes), traders have to use technical analysis – in particular, a lot of moving averages, technical indicators, drawing tools, and stock chart patterns.
On top of that, this isn’t a pick-and-choose situation – none of these tools guarantees success on their own. Only mastering all of them, and a lot of hands-on experience guarantees that a trader can properly identify a trend. Let’s just clear up a couple of more terms, and then we’ll get down to the good stuff – the actual tools used in trend trading.
Long-Term Trading 📅
Long-term trend trading falls somewhere between long-term, buy and hold investing and the other forms of trend trading. This version of the approach focuses on both the trends and long-term prospects of the asset in question.
There are a couple of advantages to this method. For one, it requires a less-hands-on approach – although a watchful eye is still preferable, a simple system of alerts or using stop-loss orders is usually enough to ensure the trade.
Since the short-term fluctuations are of less consequence, this is one of the more beginner-friendly methods – although it does require a solid knowledge of fundamental analysis. On top of all the technical analysis and different metrics to keep in mind, long-term trend trading also requires a solid understanding of how to research assets. However, on the flip side, this approach requires much less micromanagement and is much less risky.
For investors who are quite risk-averse or still don’t feel confident in their short-term trading chops, a long-term trend trading strategy will work best, because of the larger reliance on fundamental analysis. However, out of all possible strategies, this one is the least profitable.
Short-Term Trading ⏳
Trend trading strategies can be modified for use in the short term, but there is still a line that differentiates swing traders, day traders, and scalpers from trend traders. However, rather than getting into the minutiae that differentiates these approaches, let’s deal with the similarities.
Day trading, swing trading, and scalping, much like trend trading, use technical analysis, technical indicators, and price action to determine when to enter and exit the market. However, these approaches are much more time-intensive, as well as risky, than trend trading.
Most short-term traders hold positions for less than a whole day. The indicators that an uptrend or downtrend is going to occur are the same as with trend trading – but with a much shorter time frame, things are much more fast-paced and volatile.
In short (pun intended), although short-term trend trading (and other short-term trading strategies) are perfectly valid, we would discourage beginners from tackling them, at least until they’ve developed a rock-solid understanding of technical analysis and the various indicators used in it.
Different Strategies for Trend Trading 🗃
Trend trading isn’t new – it comes as little surprise that traders have managed to develop a variety of ways to detect, measure, and keep track of trends. All of these approaches fall under the umbrella of technical analysis.
None of these strategies are particularly hard to grasp or put into play – but things almost never go smoothly in live trading. Keep in mind that practice makes perfect – using a demo account or paper trading account to get acquainted with these strategies before actually risking money is a great way to increase the odds of success.
So, with that disclaimer out of the way, let’s look at the most prolific and widely-used technical indicators for trend trading.
Moving Average 🛠
Averages are one of the most commonly-used tools in technical analysis – in this regard, trend trading is no different. Although there are other averages to consider (and we’ll get to them in a bit), the moving average serves as the bread-and-butter.
Moving averages are quite simple – they represent the average price of a security in a specific timeframe. These are lagging indicators – they are based on past data, and unlike leading indicators, are held to have little predictive power. This means that their main utility is in confirming whether or not a trend is already occurring.
When looking at an uptrend, the moving average is usually underneath the line of the price – and acts as a support line. In contrast, when a downtrend is occurring, the moving average is usually above the chart and acts as a resistance line.

However, when a moving average is combined with other technical analysis tools (and sometimes even with other moving averages), it can in fact tell investors whether or not the price is going to go up, down, or sideways.
There are plenty of moving averages to choose from – the main options being the simple moving average and the exponential moving average. Moving averages can be used with various timeframes – with the most popular choices being 50 days and 200 days.
When using moving averages for trend trading, investors look for crossovers – the point where moving averages converge. If, for example, a 50-day moving average crosses the 200-day moving average – which is also known as a golden cross, then investors are looking at a good opportunity to buy.
Alternatively, when the price drops below a certain moving average, it can also signal a short-selling opportunity. Moving averages are quite simple, but they are a very versatile tool – one that is essential for most forms of short-term trading, not only trend trading.
Relative Strength Index 📃
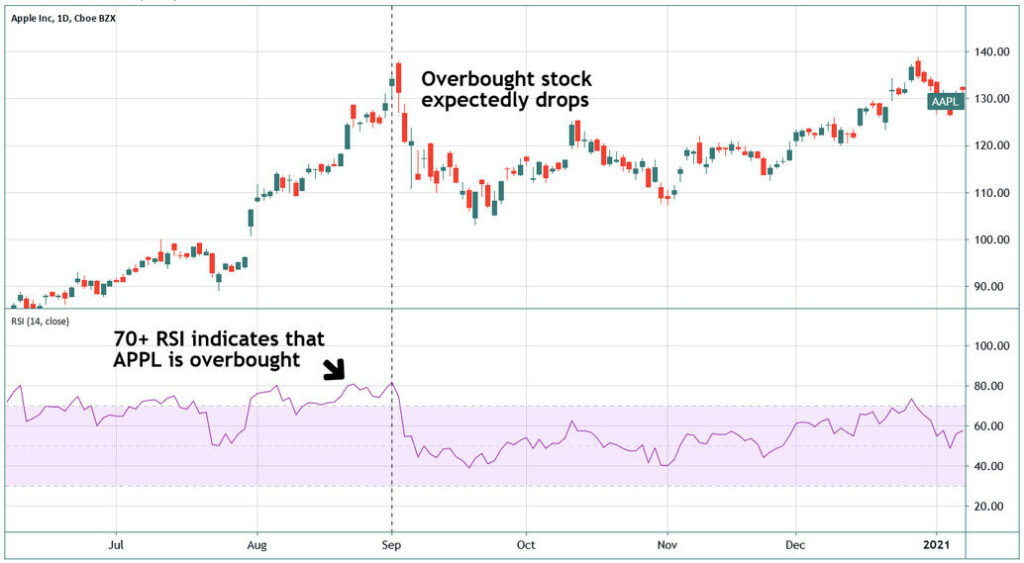
The relative strength index or RSI is a technical indicator that is used to measure velocity and momentum – with a specific focus on whether or not the security being analyzed is overbought or oversold.
The relative strength index functions as an oscillator – it fluctuates from 0 to 100. In general, an RSI of 30 or less points to a security being oversold – in other words, a security with an RSI under 30 is undervalued. Values between 30 and 70 indicate sideways trading – while values over 70 indicate a security that is overbought and overvalued.
The way that RSI works is by charting the average gains and losses in a certain period – which is usually 14 days. This is accomplished by plotting the last closing prices of a security for each of the trading days being considered.
Like all the other metrics and strategies that we will be covering, the RSI shouldn’t be used alone. Although it does give pretty accurate readings, one should always remember that an asset can stay overbought or oversold for a long time. On top of that, whereas RSI ranges from 0 to 100, the actual change in the price of the asset being analyzed can be subject to much greater changes.
The simplest way to use RSI is to formulate an exit point based on the metric. With a long position, when RSI reaches 70, the asset should be sold to lock in profits. With a short position, the reverse holds true – an RSI of 70 signals a good entry point for a short position.
Keep in mind, however, that 30 and 70 are not absolute – and although the creators of RSI preferred a 14-day analysis period, investors should always adjust the time frame to better fit their own approaches and strategies.
Chart Patterns and Trendlines 📊
Trendlines are another mainstay of technical analysis – and for those that are getting slightly weary of math by this point – rejoice! Trendlines are incredibly simple – they are simple lines plotted along the swing lows in the case of an uptrend, or the swing highs in the case of a downtrend.
These trendlines serve to highlight areas where trend reversals might occur, but they’re also incredibly useful overall – serving as a sort of mini version of support and resistance barriers. When prices drop below trendlines, it could signal the end of a trend.
Trendlines are also important for another reason – and that is stock chart patterns. Patterns are easily-discernible…well, patterns that tend to occur frequently in stock trading. They fall into one of two categories – continuation patterns, which signal that the trend will hold strong, or reversal patterns, which signal that the current trend is coming to an end, and will soon be replaced by an opposing trend.
Stock chart patterns were introduced to western traders via Steve Nilson’s book in the early nineties, and they rely on Japanese Candlestick patterns. Although learning these patterns is another entry in an already long list of homework, we strongly recommend doing so – they are deceptively easy to learn and very versatile.
With a solid overview of stock chart trading patterns, traders will have a much easier time identifying when patterns will change or hold strong. This, in turn, leads to much better exit positions, entry positions, and allows traders to hold on to trends for a longer time, thereby netting greater returns. There are a lot of chart patterns to learn – so feel free to check out our in-depth guide to stock chart patterns.
Bollinger Band 📈
Bollinger bands were introduced in the 1980s and have since become a staple of technical analysis. The bands are one of the most versatile technical indicators – they seek to answer a very simple question of whether or not prices are high or low on a relative basis.
Now, that might appear like a simple thing to do at first glance – but simply seeing how far off from average prices are isn’t enough. Instead of that, Bollinger bands also take into account something that is intricately and inextricably tied with prices – and that is volatility.
Understanding how Bollinger bands work is quite simple – a simple moving average is plotted, as well as the two bands. The two bands are plotted at a standard deviation level (to be more precise, two standard deviations away from the simple moving average).
The bands contract and expand in accordance with volatility – more volatility leads to the bands expanding, while less volatility leads to the bands contracting.

When the bands converge during a period of low volatility, it usually signals that a period of high volatility will soon follow. Although this does require a careful approach, high volatility tends to bring about trading opportunities, so this can serve as a buy signal.
However, when the bands drift too far apart, in most cases, the period of high volatility will soon come to a close, and the bands will come closer to one another again.
Another thing to keep in mind is band breakouts – when the price of a security moves beyond either the upper band or the lower band, this is a clear signal of the asset being either overbought or oversold – and a sharp price correction usually follows.
MACD 🔗
The moving average convergence divergence (MACD) is an average used as an indicator in technical analysis. Although it might sound like a mouthful, it is deceptively simple – the MACD is simply a relationship between two moving averages – and that relationship can be used as a pretty reliable trading signal when combined with other methods.
So, how does the MACD work? It’s simple – it calculates the difference between a security’s 26-day exponential moving average (slower) and 12-day exponential moving average (faster).
With the MACD, two lines are plotted on a chart – the first, called the MACD line, is the difference between a longer and a shorter EMA – the second, the signal line, is the moving average of the difference between the long and short EMA. Don’t worry – this stuff has been built-in to trading tools for a while now, and all of the premier stock brokerages have automated this process via drawing tools.
The MACD smooths out minute-to-minute fluctuations in asset price. If the shorter EMA is higher than the longer one (which can be seen by looking at the first line), then the asset is an uptrend, which is a buying opportunity – if the longer EMA is higher than the shorter one, a downtrend is occurring, meaning that an opportunity to sell or short is at hand.

As for the MACD line, the further away it is from the baseline, the greater the difference between the two moving averages. This serves as a helpful shorthand – if the line is far away from the baseline, the price movement is accelerating, and if it is close to the baseline, price movements are slowing down, signaling an end to a trend.
Another thing to note is MACD crossovers, which are powerful buy and sell signals. When the MACD crosses over and under the signal line, this is a strong bearish signal – when the opposite happens and the MACD crosses over and above the signal line, it is a strong bullish indicator.
ADX and DMI 📉
Last but not least, the average directional index (ADX) and directional movement index (DMI) are two indicators that focus on measuring the strength and direction of a trend – something that, understandably, trend traders are interested in.
The ADX is plotted as a single line that varies from 0 to 100. If the values of the ADX hover around 25 or under, then there is no trend present – this, in itself, can serve as a valuable tool for weeding out real trading opportunities from false ones. The stronger the ADX, the stronger the trend.
The DMI takes the form of two lines plotted alongside the ADX – +DI, the positive directional indicator, and -DI, the negative directional indicator. The +DI measures how strongly upward price movements are occurring, while the -DI measures how strongly downward price movements are occurring.

Much like the other technical indicators, we’re interested in crossovers when it comes to DMI. When the +DI touches and crosses over and above -DI, this is a sign of an uptrend beginning – conversely, when -DI touches and crosses under +DI, this is a sign of a downtrend beginning. In both of these cases, investors should look to ADX for confirmation – a DMI crossover without an ADX value of 25 or over isn’t a reliable sign of anything.
An Example of Trend Trading 📝
So, now that we’ve covered everything regarding classic trend trading, let’s put it all to use with an example, which will help us absorb all that knowledge. There is a lot of stuff to mention here, so take a look at the chart below – and feel free to get back to it as we go through this example.
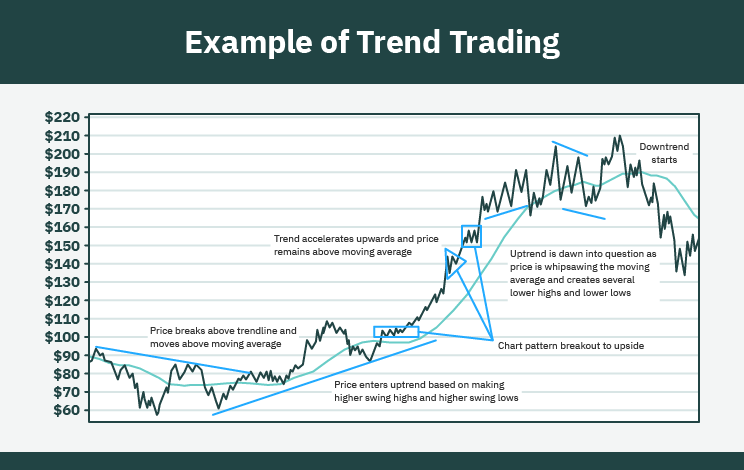
As we can see in the example above, the price action in the beginning is quite normal – although there are some fluctuations, sideways trading is the name of the game. For this example, the technical indicators we’ll be using are trendlines and moving averages.
When the asset price breaks above the initial trendline and goes above the moving average, the possibility of an uptrend occurs. Once the asset price experiences higher highs and lower lows, we have confirmation – and the trend accelerates, with the price remaining above the moving average all the while.
Next, we see a couple of stock chart patterns – all of which serve to confirm trend continuation. As we go further along, the asset price starts whipsawing – we can clearly see several rapid changes, as well as lower highs and lower lows. On top of that, the asset price is no longer reliably above the moving average.
This serves as a warning sign – at best, the trend has become risky, and at worse, it is drawing to a close. Although these are dire signs, a trader should always confer with other indicators and averages to confirm – however, in this case, the warning sign was right on the money.
This is the ideal time to close out positions and secure profits – and the more enterprising traders among us might also consider entering short positions here. Although this is a typical representation of a trend, it is clear that this style of trading is still quite dynamic – it requires attention, as well as a good mastery of technical analysis.
Trade Trending Reversals ♻
Trends sometimes run out of steam and are followed by sideways price action – however, this does not always happen. Sometimes, an uptrend will lead directly into a downtrend, or vice versa – this is called a trend reversal.
Trend reversals are incredibly important in trend trading. When a trend reversal is about to occur, investors should take their profits, reorganize, regroup, and find a new entry position.
At first glance, trend reversals are hard to differentiate from pullbacks – but the difference lies in the question of degree. A pullback is a small change or counter-move that happens within the confines of a trend – whereas a reversal is, well, a reversal of the trend. A reversal doesn’t happen until the price of the asset reaches lower lows compared to previous time frames.
While reversals also hold plenty of opportunities to make money, they are much rarer when compared to regular trends – on top of that, reversals are inherently riskier, and the rules of trading psychology stipulate that reversals can easily lead to panic selling, further disrupting the asset’s price.
So, how can an investor identify a trend reversal? Well, apart from keeping a close eye on RSI, moving averages, and everything we’ve talked to up to now, there are a couple of telltale signs: prices reaching close to or exactly at support lines in quick succession, the presence of trend reversal stock chart patterns, as well as various other macroeconomic factors, have to be taken into account.
Counter-Trend Trading 👨🏫
Counter-trend trading is a trend trading strategy that seeks to capture profits from trend reversals. As far as the time horizon goes, it falls squarely under medium-term strategies and has a lot of similarities with swing trading (more on that later).
As with all trend trading strategies, counter-trend trading relies on properly identifying an upcoming change in the market – in this case, a reversal, before other market participants can react.
The easiest way to utilize counter-trend trading is to buy or sell an asset when it experiences an impulsive, temporary price move (which can be either bullish or bearish). If the trend holds, the price will revert back, and the trade will be profitable seeing as how the trader can buy/sell the asset at the old, more enticing price.
Although the timeframe for countertrend trading depends on the investor, in general, most trades of this type require that the asset be held for a minimum of a couple of days and a maximum of a couple of weeks.
Counter trend trading has a couple of benefits – for one, this approach allows for a lot more opportunities, as temporary price moves happen all the time. The higher frequency of trading means that drawdowns are shallower, but this comes at a price – high-frequency trading is often very expensive.
However, this can easily be remedied – a lot of the top-rated stock brokerages for beginners have a “per-stock” pricing model, or offer commission-free trading. On the other hand, counter-trend trading requires a lot of focus – the shorter time frame necessitates a lot of hands-on action, as well as frequently monitoring the market. Because the margin of error is so much smaller with counter trend trading, it requires a rock-solid understanding of technical analysis and intimate knowledge of a variety of technical indicators and charting tools.
Trend Trading vs. Swing Trading ⚔
Swing trading is one of the more popular approaches to short-term trading. It isn’t as demanding as scalping or day trading and doesn’t require the long investment horizon that buy-and-hold investing does.
Most approaches to trend trading (with the exception of long-term trend trading) are quite similar to swing trading – although there are a couple of key differences that should be noted. On the whole, the two approaches are quite similar – but knowing the exact differences between them allows investors to pursue the method that best suits their needs and preferences.
Swing trading works by leveraging the small price movements that occur within a trend. In other words, the time horizon is much shorter – whereas a trend trader will most likely hold an asset for a longer time. On top of that, swing traders generally make more trades than trend traders.
Swing traders focus on ranges – with the goal being to buy at support levels and sell at resistance levels. In contrast, trend traders take bets on whether or not an uptrend or a downtrend will occur.
Swing trading is generally riskier, and swing traders also run the risk of missing wider trends by focusing exclusively on the short term. Whereas trend traders also take macroeconomic factors into consideration, swing traders focus almost exclusively on price action.
Swing traders are much more likely to make use of leverage and use larger position sizes. Finding opportunities with swing trading is much easier – since the market spends roughly 20% of the time in trends and 80% in trading ranges.
Although both of these approaches can be combined into a hybrid of sorts, the general rule is that investors should choose one of these approaches and fully master it before trying out the other approach.
Pros and Cons ⚖
Alright – now that we’ve covered almost everything there is to know about trend trading, it is time for a short summary. Although trend trading is nominally simple, there are a lot of small details that make the difference between failure and success here – sometimes, we just have to take a step back and simply categorize the benefits and drawbacks of an investment method.
Let’s begin with advantages – and as far as the pros go, things are quite simple and straightforward. Trend trading is beginner-friendly, and doesn’t require quite the quick thinking and reflexes that day trading does. The strategy can be adapted to various time horizons, and some methods that depend on fundamental analysis are much more akin to long-term investing.
The use of complex order types such as stop-loss orders can go a long way in making this strategy quite low on risk. It is less time intensive when compared to other short-term strategies, and catching a trend early means that entry and exit points don’t have to be pinpoint accurate in order to secure profits.
However, there are also a couple of significant drawbacks that are worth mentioning. There is a bit of a learning curve involved – especially for investors who up to this point have only dealt with fundamentals. Technical analysis requires knowledge of a lot of metrics, averages, and charting tools – and since none of them are 100% reliable, it takes experience to make up for that fact.
On top of that, although trend trading isn’t as involved as day trading is, keeping close attention is still required – after all, the strategy doesn’t work if an investor doesn’t identify a trend as soon as possible. More to the point, trend trading can be nerve-wracking in another way – instead of too much action, it is possible that investors will encounter long periods of time without any significant action – which can make false breakouts and false trend signals look appealing.
How to Trend Trade Cryptocurrencies 🪙
Although trend trading is usually used for trading stocks, the approach can be modified for a variety of other asset classes. However, no other asset class attracts as much attention as the rapidly expanding cryptocurrency market.
Trend trading can be applied to cryptocurrencies, but doing so successfully will require a couple of adjustments. For one, it will come as no surprise that a lot of crypto tokens are incredibly volatile – particularly small ones and so-called altcoins. But make no mistake – flash crashes can happen even to more popular and well-known tokens, such as Bitcoin or Ethereum, as seen in a recent crash.
All of the regular rules regarding trend trading still apply here – but we would caution investors to be even more careful. Because of the added volatility, RSI should always be taken into account, stop-loss orders should always be put in place to prevent losses, and using conservative position sizes (no more than 2% of a portfolio per trade) are non-negotiable risk-management strategies.
Another thing to note is that crypto is still developing, and as such, it is an incredibly diverse market. Although BTC, ETH, and other tokens such as USDT have hit the mainstream, there are a lot of opportunities to be found with other, smaller tokens.
However, would-be trend traders interested in altcoins should always do a deep dive on market depth and average trading volume for the coins in question. If those safeguards are in place, using indicators such as RSI to identify oversold cryptocurrencies can be a great way to find trend trading opportunities.
And last but not least, although we’ve all heard dozens of tales of crypto millionaires, don’t get greedy – setting reasonable price targets leads to guaranteed profits – getting greedy leads to accounts getting zeroed.
Final Word: Should You Consider Trend Trading? 🏁
When all is said and done, trend trading has a lot going for it. It is a short-term strategy but doesn’t require the iron nerves or constant monitoring that day trading and swing trading do. Unlike those strategies, trend trading is quite versatile, and can be adapted to a variety of needs.
The profit potential is also another benefit of trend trading – locking in profits takes much less time than it does with true long-term strategies such as buy and hold investing.
So, all in all, is this strategy worth considering? The answer is a resounding yes – short-term traders will be hard-pressed to find a more forgiving strategy, and even those who end up choosing different approaches will benefit from the knowledge required to try trend trading. As for long-term investors, this strategy represents by far the best way to get into short-term trading.
Trend Trading: FAQs
-
What is a Trend Trader?
A trend trader is an investor who seeks to identify trends as soon as they appear, use them to lock in profits, and liquidate their investments before the trend reverses.
-
Does Trend Trading Work?
Yes - provided that due diligence is performed and that an investor takes the time to apply proper technical analysis through a variety of channels, trend trading is one of the simpler and more reliable approaches to short-term trading.
-
Is Trend Trading Good for Beginners?
Trend trading is an approach that is easy to put into play, but difficult to master. However, on the whole, it is one of the more beginner-friendly short-term and technical analysis-based approaches to trading in the stock market.
-
Is Trend Line Trading Profitable?
Yes - provided that proper risk management strategies such as using stop-loss orders are in place, and that the trader practices proper technical analysis, trend line trading can be a very profitable strategy.
-
How Do You Know When a Trend is Ending?
The easiest way to tell that a trend is ending is by looking at technical indicators such as averages, RSI, MACD, and DMI. Each of these indicators has a way of indicating that a trend is about to end.
-
How Do You Catch a Trend Early?
Catching a trend early is possible, so long as investors keep a close eye on wider changes in the market, macroeconomic news, and regularly check the salient technical indicators pertaining to the asset in question.
-
How Long Do Trends Last?
There are no hard and fast rules as to how long trends usually last. This is the reason why trend trading works in principle - the fact that there are no solid rules as to how long trends last means that identifying when a trend is coming to an end gives investors a huge advantage over the competition. The only way to reliably tell when a trend is ending is to become very adept at technical analysis, reading stock chart patterns, and using technical indicators and drawing tools.
-
How Can You Tell a Bullish Trend?
A bullish trend or a downtrend is characterized by lower highs and lower lows, and can also be confirmed by using a variety of technical indicators - chiefly moving averages, RSI, and ADX/DMI.
Get Started with a Stock Broker
$0
$0
$0
$0
$0
Vary
DIY stock trading
Active traders
Pioneer of commission-free stock trading
Huge discounts for high-volume trading
Free stock
$0
$500
$0
$0
Vary
$0
Active traders
Beginners and mutual fund investors
Huge discounts for high-volume trading
Low fees


Account minimum
$0
$0
$500
Minimum initial deposit
$0
$0
$0
Commissions
$0
Vary
$0
Best for
DIY stock trading
Active traders
Beginners and mutual fund investors
Highlight
Pioneer of commission-free stock trading
Huge discounts for high-volume trading
Low fees
Promotion
Free stock
All reviews, research, news and assessments of any kind on The Tokenist are compiled using a strict editorial review process by our editorial team. Neither our writers nor our editors receive direct compensation of any kind to publish information on tokenist.com. Our company, Tokenist Media LLC, is community supported and may receive a small commission when you purchase products or services through links on our website. Click here for a full list of our partners and an in-depth explanation on how we get paid.


