BTC+1.04%
Crypto
BTC+1.04%
Crypto
On-Chain Data Suggest Bitcoin Selloff Driven by Spot Markets, Not Futures
Amidst the growing negative market sentiments, on-chain statistics indicate that recent selloff wasn't driven by derivatives.


Editorial disclosureRead more
All reviews, research, news and assessments of any kind on The Tokenist are compiled using a strict editorial review process by our editorial team. Neither our writers nor our editors receive direct compensation of any kind to publish information on tokenist.com. Our company, Tokenist Media LLC, is community supported and may receive a small commission when you purchase products or services through links on our website. Click here for a full list of our partners and an in-depth explanation on how we get paid.
A recent report by Kaiko shows that there has been a substantial decline in Bitcoin and Ethereum’s weekly trade volume since the beginning of 2022. Both digital assets surged between January and May 2021 and are now struggling slightly above where they were before.

Despite the continued nose dive in trading volume, volatility began to cool off from September 2021. Afterward, weekly trading volume for both assets has remained relatively stable, while price action for both digital currencies continues in lockstep. This development suggests a calculated effort to de-risk their positions and not a desperate futures market sell-off. Historical records prove that the volume of traded assets is always low during summer.
Neutral Funding Rate Suggests Deleveraging
More data sources from Kaiko corroborate the narrative that the futures market did not drive the recent sell-off. A closer observation of Bitcoin’s derivatives market shows that finding rates on BTC perpetual futures maintained their trend despite the price dump.
Funding rates are periodic payments given to traders that are long or short depending on the spread between perpetual contract markets and spot prices. This metric stood around 0.005% above neutral.
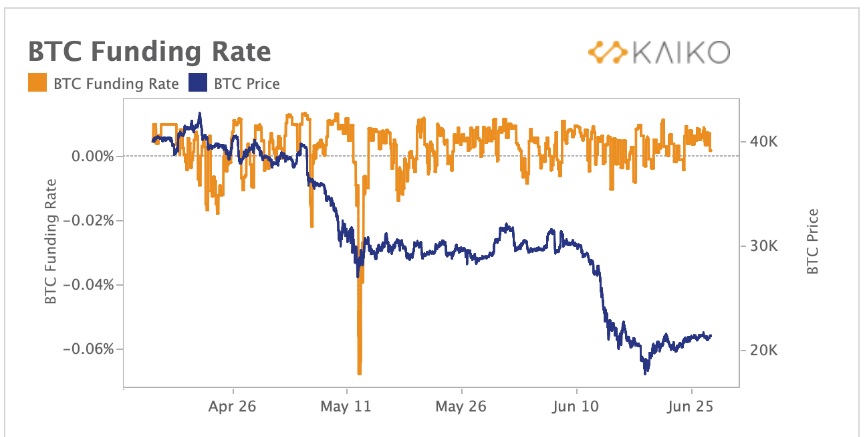
There would have been a steep descent into the negative zone if the futures market sparked the recent sell-off. This was the case with Terra’s failure last month. For perspective, the chart reveals that the futures market propelled BTC’s price action on May 11 as funding rates fell below the negative .06%. The alignment of these events strengthens the thesis that the recent market downturn was spot driven as investors sought to mitigate risk.

Join our Telegram group and never miss a breaking digital asset story.
A Diverging Correlation Between Stocks and Bitcoin
BTC’s correlation with tech stocks on Nasdaq 100 weakened in June after going as high as 0.8 in May for the first in many years. Although this similarity in price movement has slowed considerably, it still sits considerably above levels before hitting an all-time high.
The flagship cryptocurrency has remained range-bound since the past week, oscillating around the $21,000 price mark. Meanwhile, the Nasdaq closed the week above 7%. Bitcoin has been largely uncorrelated from safe-haven like gold, while its relationship with the greenback has fluctuated between zero and negative 0.6 since January 2022.
Investors scaled back their expectations on the interest rate hike, which resulted in last week’s market recovery. Market participants still expect tighter economic conditions that will lead to a recession in Europe and the US. Financial experts believe the weakening economic data have flared hopes that a slow-down would dampen the raging inflation figures.
Bitcoin’s price managed a quick recovery after plunging as low as $18,000. After consolidating above the $20,000 price range for the past 14 days, the pioneer crypto-asset posted mild gains of 1.1% on a 7-day chart. Many analysts have their eyes on the 20k mark as they believe it to be a critical support level.
Do you think more investors will exit their position from the market in the coming weeks? Let us know your thoughts in the comments below.

Kingsley Alo
<div>Alo Kingsley is a finance writer with over 4 years of experience covering blockchain and cryptocurrency news. Alo first discovered Bitcoin in 2016 and has been passionate about it ever since, particulary the various ways blockchain can help Africa and the world at large. He aims to give the crypto space a more geographically balanced narrative as it evolves. His articles have been featured in Cointelegraph, Beincrypto, and Forkast.news, among other publications.</div>