


 BTC-0.93%
Market Analysis
BTC-0.93%
Market Analysis
Bitcoin Price Falls to $65,700 as Record ETF Outflows and Strategy Sale Hit Sentiment
Bitcoin Falls to $65,710 as ETF Outflows and Strategy Sale Hit


Editorial disclosureRead more
All reviews, research, news and assessments of any kind on The Tokenist are compiled using a strict editorial review process by our editorial team. Neither our writers nor our editors receive direct compensation of any kind to publish information on tokenist.com. Our company, Tokenist Media LLC, is community supported and may receive a small commission when you purchase products or services through links on our website. Click here for a full list of our partners and an in-depth explanation on how we get paid.
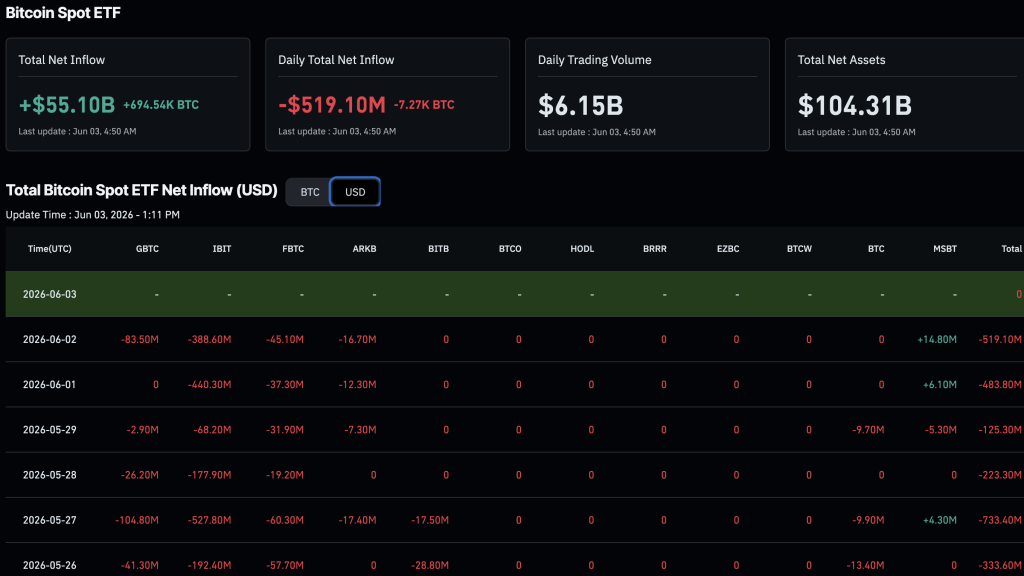
The Bitcoin price dipped to an intraday low of $65,710 on June 3, 2026, falling over -6% in 24 hours due to significant spot ETF outflows estimated at $2.8Bn to $3.5Bn and a notable bitcoin sale by Strategy, a key corporate buyer since 2020.
This pressure led to $1.8Bn in forced liquidations in one day, the largest since February 2026, with long positions accounting for $1.35Bn of that. The $65,710 level marks a multi-week low, placing Bitcoin close to the $65,000 technical support, which traders view as crucial before a potential test of $60,000.
Unlike previous sharp ETF outflow events, this sustained withdrawal over 10 to 11 days represents a significant institutional exit that has gradually weakened the market.
Record ETF Outflows: The $2.8Bn–$3.5Bn Redemption Streak and What the Cross-Fund Alignment Reveals
Cumulative net outflows from US spot bitcoin ETFs have reached approximately $2.8Bn to $3.5Bn over 10 to 11 consecutive days of redemptions.
This marks the longest withdrawal streak since the products were launched in January 2024, pushing year-to-date flows into negative territory.
The simultaneous redemptions across major funds such as iShares Bitcoin Trust (IBIT), Fidelity’s FBTC, Grayscale’s GBTC, and ARK’s ARKB indicate macro-driven institutional de-risking rather than issues specific to individual products.
Notably, IBIT, which holds the largest share of US spot bitcoin ETF assets, typically sees the greatest dollar outflows during these periods.
This trend has also been observed globally, with European crypto ETPs recording about $1.67Bn in outflows in the week of May 25–29, emphasizing a broader institutional reassessment of digital asset exposure.
Bitcoin Price: Strategy’s BTC Sale – How 32 BTC and a Shifted Narrative Compounded Selling Pressure
Strategy’s recent sale of 32 BTC at an average price of approximately $77,135, generating around $2.5M, represents less than 0.004% of its $60Bn bitcoin treasury. While the sale’s size is minor, its implications are significant.
Since 2020, Strategy has been a prominent corporate bitcoin buyer, and this shift towards selling, especially following Michael Saylor’s comments about possibly selling to fund dividends, adds uncertainty to the market.
In response, Strategy’s shares dropped nearly 6%, reflecting concerns that its “never sell” strategy may be weakening, potentially increasing BTC supply in the future. This perception likely contributed to Bitcoin’s decline toward $65,710, as the sale was seen as an indication of future treasury actions.
Macro Backdrop: How Inflation Data, AI Rotation, and Stalled Whale Buying Enabled Both Catalysts to Land Hard
As of June 3, the macro environment for Bitcoin had weakened, driven by hotter-than-expected inflation, weaker GDP data, and geopolitical tensions in Iran.
This led institutions to adopt a defensive stance and shift funds toward AI and semiconductor stocks, diverting capital from crypto.
On the same day, Bitcoin price fell 6%, and equity markets reached new highs, suggesting the sell-off was linked to specific crypto issues rather than broader market fear.
On-chain data showed that whale accumulation had stalled in May, resulting in fewer large bids to absorb ETF-driven supply during redemptions.
Additionally, the rising Treasury yields created structural headwinds for Bitcoin, amplifying drawdowns. The upcoming Federal Reserve communications and US inflation data will be crucial in determining if the macro landscape stabilizes and slows ETF redemptions.
Bitcoin Price: $65,710 as the Pivot Level and What the Liquidation Data and Equity Spillover Means
The $65,710 intraday low sets the immediate downside reference, with $65,000 as the first technical support and $60,000 as a target if $65,000 breaks.
Ether’s drop below $1,900 shows that the liquidation cascade affected the broader crypto market, including public equities like crypto miners and Coinbase (COIN).
The bull case hinges on exhaustion of ETF outflows; past episodes suggest that aggressive long liquidations can mark local bottoms, especially when driven by leverage.
For the Bitcoin price, a recovery above $66,000 on volume, spurred by positive CPI data or dovish Fed signals, could validate current support.
Conversely, the bear case arises if $65,000 fails, potentially leading to $60,000 due to sustained ETF redemptions and negative market conditions.
The most likely scenario remains a range-bound consolidation between $65,000 and $68,000 as the market awaits clarity on ETF flows and Strategy treasury disclosures.
The author does not hold or have a position in any securities discussed in the article. All stock prices were quoted at the time of writing.

Tim Baker
Tim Baker is a Senior Market Analyst at Tokenist with over a decade of experience educating readers about traditional finance, crypto and DeFi. A former equity researcher turned on-chain analyst, Tim specializes in regulatory framework shifts and institutional DeFi adoption. His work focuses on distilling complex liquidity cycles and the macro environment into actionable intelligence for the modern DIY investor.


